多处理器系统机群故障的概率故障诊断
-
摘要:研究背景
随着计算机通讯技术的繁荣发展,多处理器系统的规模(处理器数量)也在不断增长,不可避免地会有一些处理器发生故障,因此,处理器的故障诊断问题对系统运行的可靠性尤为重要。系统级故障诊断分为两类:确定性故障诊断和不确定性故障诊断。确定性故障诊断总是可以正确并且完全的执行诊断任务,也就是说,无故障处理器通过系统测试可以完全诊断出被测试者的状态。作为不确定性诊断的一种,本文所研究的概率性故障诊断,是假定系统中的每个处理器都有一定概率发生故障,因而只需保证诊断任务高概率地被完全正确的执行即可,这极大地减少了系统的损失,也更符合现实环境。因此,用概率的方法来解决大规模多处理器系统的故障诊断问题对分析系统可靠性有一定价值。
目的我们以具有一般性的d-正则d-连通图G为研究对象,旨在解决这类图的概率故障诊断问题。具体地,根据系统中任意结点发生故障概率的离散性与连续性,分别研究了此类图的局部概率故障诊断与全局概率故障诊断。
此问题的研究动机:2019年,文献[1]([1] Probabilistic diagnosis of clustered faults for hypercube-based multiprocessor system. Theor. Comput. Sci., 2019, 793: 113-131.) 针对围长为4的特殊图超立方体给出了阈值为3的概率故障诊断研究。然而,对于一般正则图在阈值为3的概率故障诊断方面还未有人涉及,我们考虑在围长大于等于6的一般正则图上建立阈值为3的概率故障诊断算法,这种方法适用于一类图,如星图、煎饼图及燃烧煎饼图等,结果更具一般性。
方法首先,针对图G给出了阈值为3的局部故障诊断算法,该算法的主要思想是采用广度优先搜索策略,结合断片(faction)的定义及性质,以确定能够正确诊断出断片中所有结点的状态。进一步,通过反证法证明了该算法的正确性并证明了其时间复杂度是多项式级别的。基于此算法,结合概率PMC模型,我们按照结点的状态及与其关联的匹配边数分为8类进行讨论,证明了在离散状态下图G中任意结点故障的概率为常数时,此类正则图中结点被正确诊断的概率。
其次,运用拉普拉斯变换,将离散状态下单个结点故障的概率转换为连续随机变量,并基于韦伯故障分布和卡方故障分布证明了此类正则图在连续随机状态下所有结点都能够被正确诊断的概率。
结果(1)对于d-正则d-连通图的局部故障诊断方面,假设任意结点无故障的概率为常数p,按照与结点a相邻的匹配边数不同分以下8种情况,那么无故障结点a被正确诊断的概率为Pc(a+)=1−∑8i=1Piw(a+)(如下表1),故障结点a被正确诊断的概率为Pc(a−)= ∑8i=1Pic(a−)(如下表2)。
表1 八种不同故障机群模式下无故障结点a被误诊的概率 故障机群模式 a无故障结点被误诊的概率 Fig. 2(a) P1w(a+) = (1−p)dγd Fig. 3(a) P2w(a+) = dp(1−p)2d−2γ2d−2 Fig. 4(a) P3w(a+) = d(1−γ)γd−1θd−1(1−p)d Fig. 5(a) P4w(a+) = d(d−1)p(1−p)2d−2γ2d−3[p(1−p)d−2γd−1+θd−1(1−γ) Fig. 6(a) P5w(a+) = d(d−1)(1−γ)γd−1θd−2(1−p)d + 1[p(1−p)d−2(1−γ)γd−1+θd−1β] Fig. 7(a) P6w(a+) = (d2)p2(1−p)3d−4γ3d−4 Fig.8(a) P7w(a+) = (d2)p(1−γ)(1−p)2d−2γ2d−3θd−1 Fig. 9(a) P8w(a+) = (d2)γd−2(1−γ)2(1−p)dθ2d−2 表2 八种不同故障机群模式下故障结点a被正确诊断的概率 故障机群模式 故障结点a被正确诊断的概率 Fig. 2(b) P1c(a−) = θd Fig. 3(b) P2c(a−) = d(1−γ)γd−1p(1−p)d−1θd−1 Fig. 4(b) P3c(a−) = d(1−p)βθ2d−2 Fig. 5(b) P4c(a−) = d(d−1)p(1−p)d−1(1−γ)γd−2θd−1[p(1−p)d−2γd−1+(1−γ)θd−1] Fig. 6(b) P5c(a−) = d(d−1)(1−p)2βθ2d−3[p(1−p)d−2(1−γ)γd−1+θd−1] Fig. 7(b) P6c(a−) = (d2)γ2d−2(1−γ)2p2(1−p)2d−2θd−2 Fig. 8(b) P7c(a−) = (d2)βγd−1(1−γ)p(1−p)dθ2d−3 Fig. 9(b) P8c(a−) = (d2)β2(1−p)2θ3d−4 (2)对于d-正则d-连通图的全局故障诊断方面,假设任意结点无故障的概率p为随机变量,表示为p=e−m。运用拉普拉斯变换L(s)=∫∞0e−smf(m)dm(s⩾)可得:
Y = E(p) = \int_0^\infty {{e^{ - m}}f(m)} dm{\text{ = }}L(1) ,Y=1–F。
其中,Y表示G中所有被诊断为无故障结点的数学期望,F表示G中所有被诊断为故障结点的数学期望。另外,{Y_c} 表示无故障结点被正确诊断的数学期望,{F_c} 表示故障结点被正确诊断的数学期望。
(2.1)在韦伯分布下,d-正则d-连通图G中的所有结点被正确诊断的概率为:
\frac{{{Y_c}}}{Y} = 1 + \sum\limits_{i = 0}^{3d - 2} {{w_i}\frac{{\mu + 1}}{{\mu + i + 1}}},
\frac{{{F_c}}}{F} = \frac{{(1 - k)\mu + 1}}{{1 + \mu }}\Bigg[{\hat w_0} + \sum\limits_{i = 1}^{3d - 2} ({{\hat w}_i} - {{\hat w}_{i + 1}})\frac{{k\mu }}{{\mu + i}} -{\hat w_{3d - 2}}\frac{{k\mu }}{{\mu + 3d - 1}}\Bigg] ,
其中, \lambda 为韦伯分布的规模系数,m为韦伯分布的随机变量, \mu {\text{ = }}{m^{k - 1}}/{\lambda ^k} 。当参数 k\to 0 , {\hat w_0} \to 1 ,d \to \infty 时,\dfrac{{{Y_c}}}{Y} \to 1 ,dfrac{{{F_c}}}{F} \to 1 。
(2.2)在卡方分布下,d-正则d-连通图G中的所有结点被正确诊断的概率为:
\frac{{{Y_c}}}{Y} = 1 + \sum\limits_{i = 0}^{3d - 2} {{w_i}\Bigg[\frac{{1{\text{ + }}\lambda {\text{/}}\sigma }}{{1{\text{ + }}(i + 1)\lambda {\text{/}}\sigma }}} {\Bigg]^{ - \sigma }} ,
\frac{{{F_c}}}{F} = \frac{1}{{1 - {{(1{\text{ + }}\lambda {\text{/}}\sigma )}^{ - \sigma }}}}\Bigg[{\hat w_0} + \sum\limits_{i = 1}^{3d - 2} ({{\hat w}_i} - {{\hat w}_{i + 1}}){{(1 + i\lambda /\sigma )}^{ - \sigma }} - {{\hat w}_{3d - 2}}{{(1 + (3d - 1)\lambda /\sigma )}^{ - \sigma }}\Bigg]
其中,\sigma \text{=}k/2 为卡方分布的机群系数,k为卡方分布的自由度, \lambda \text{=}2\sigma 为随机变量m的平均值。当参数 {\widehat{w}}_{0}\to 1 ,d\to \infty 时,\frac{{{Y_c}}}{Y} \to 1 ,\frac{{{F_c}}}{F} \to 1 。
综上,在韦伯故障分布与卡方故障分布下,此类d-正则d-连通图中的所有结点的状态都能被正确诊断的概率趋于1。
结论概率性故障诊断由于其花费少、更贴近实际而受到大家的关注。本文将基于一般正则图的多处理器系统作为研究对象,建立了阈值为3的局部故障诊断算法,并通过反证法证明了此算法的正确性。在概率PMC模型下,使用此局部故障诊断算法评估了围长大于等于6(围长限制表明断片中任意两个不相邻结点之间的公共点数至多为1)的一般正则图中任意结点被正确诊断的概率。然而,关于阈值为3且围长小于6的网络,如类超立方网络、交错群网络、复合网络等,在概率故障诊断方面的研究还鲜少有人涉及,未来可考虑研究符合此特性的网络在概率故障诊断方面的研究,从而提供不同的角度分析网络的可靠性。此外,不同的阈值对故障诊断有一定影响(.若断片大小大于等于阈值,则此断片被诊断为一个真正的无故障分支,否则,此断片被诊断为故障),目前仅对较小的阈值进行研究,而更大阈值的意义在于断片中更多结点的状态将能够被确定性地诊断,因此,研究阈值的峰值也是值得思考的问题。
Abstract:With the development of high-performance computing and the expansion of large-scale multiprocessor systems, it is significant to study the reliability of systems. Probabilistic fault diagnosis is of practical value to the reliability analysis of multiprocessor systems. In this paper, we design a linear time diagnosis algorithm with the multiprocessor system whose threshold is set to 3, where the probability that any node is correctly diagnosed in the discrete state can be calculated. Furthermore, we give the probabilities that all nodes of a d-regular and d-connected graph can be correctly diagnosed in the continuous state under the Weibull fault distribution and the Chi-square fault distribution. We prove that they approach to 1, which implies that our diagnosis algorithm can correctly diagnose almost all nodes of the graph.
-
1. Introduction
With the vigorous development of computer communication technology, the scale of multiprocessor systems (the number of processors) is increasing. It is inevitable that some processors in such systems fail. Therefore, the fault diagnosis of processors becomes crucial. The most widely discussed system-level fault diagnosis of multiprocessor systems is mainly divided into two categories: deterministic fault diagnosis and uncertain fault diagnosis[1]. Deterministic fault diagnosis can always absolutely and correctly complete the diagnosis task, that is, it requires that the test result of a fault-free node completely reflect the state of the tested node. The deterministic fault diagnosis model was first proposed by Preparata et al.[2], called the PMC (Preparata Metze Chien) model, which has been widely studied[3-9]. Under the PMC model, the outcome on the testing of a faulty node cannot be trusted while the outcome on the testing of a fault-free node is reliable (see Table 1). In an actual network, deterministic fault diagnosis may not necessarily be realized, such as the fault caused by the loss of test results[10], and the intermittent fault caused by some external interferences[11, 12]. As a kind of uncertain diagnosis, probabilistic fault diagnosis only requires the task to be completed correctly with a high probability, which greatly reduces the cost. Therefore, it is worth exploring the fault diagnosis of large-scale multiprocessor systems by the probability method.
Table 1. PMC ModelTester a Testee b \delta(a, b) Fault-free Fault-free 0 Fault-free Faulty 1 Faulty Fault-free 0 or 1 Faulty Faulty 0 or 1 Note: The state of a node is “fault-free” means that this node can work normally, whereas that the state of a node is “faulty” means that this node cannot work normally. Probabilistic fault diagnosis has attracted extensive attention because of its small costs and real-time performance. Blough et al.[13] proposed a probabilistic approach, which shows that each node can be correctly diagnosed when the test time of each node is slightly longer than the linear test time. Fussell and Rangarajan[14] presented a corresponding probabilistic diagnosis algorithm. Subsequently, Tang and Song[15] put forward the diagnosis algorithm based on a voting scheme, and proved that this diagnosis strategy can detect nearly all nodes, where the threshold k=1 and the network scale n\rightarrow \infty . Rangarajan and Fussell[16] gave a new hierarchical algorithm for k=1 . Note that the threshold k is a central parameter to determine whether there are faulty clusters in a multiprocessor system, which reflects the size of a faction. A faction is defined as a connected subgraph with consistent syndrome. The larger the threshold k , the more likely all nodes in the faction are to be fault-free. The diagnosis algorithm with k=2 to diagnose the state of the node cluster in simple rectangular grid was provided by Huang et al.[17]. Tang et al.[18] studied the probabilistic fault diagnosis of a regular topology in which any pair of adjacent nodes do not have common neighbors for k=2 . On this basis, Lu et al.[19] further elaborated on the problem of probabilistic diagnosis of arbitrary topologies with shared nodes. Lately, the probabilistic diagnosis of clustered faults of hypercube for k=3 was explored by Lv et al.[20]. Motivated by this, we further consider general regular graphs with the girth of at least 6, which contain a large class of networks, such as star graphs[21], pancake networks[22], and burning pancake networks[23]. On the one hand, we establish a diagnosis algorithm with the linear time complexity, which extends the threshold proposed in [18] from k\leqslant 2 to k=3 . On the other hand, this paper focuses on the probabilistic fault diagnosis of the d -regular and d -connected graph, which is an improvement on [20]. More specifically, we give the probabilities that all nodes of the d -regular and d -connected graph can be correctly diagnosed in the continuous state under the Weibull fault distribution and the Chi-square fault distribution. We prove that they approach to 1, which implies that our diagnosis algorithm can correctly diagnose almost all nodes of the graph.
The remainder of the paper is arranged as follows. Some basic notations and definitions are given in Section 2. We then give the diagnosis algorithm of general graphs in Section 3. Afterwards, Section 4 and Section 5 analyze the performance of the local and global fault distributions of general regular graphs, respectively. Section 6 summarizes the study.
2. Preliminaries
A multiprocessor system can be denoted as a simple and undirected graph G=(V, E) , where V denotes the set of nodes and E denotes the set of edges in G . The graph consists of |V| processors that are homogenous to one another, where every node a\in V indicates a processor, and every edge (a, b)\in E indicates a physical link between a and b . The neighborhood N(a) of any node a is defined as the set of all nodes adjacent to a . The size of N(a) is expressed as the degree of node a , that is, d(a)=|N(a)| . The maximum degree is represented by \Delta= \max \{d(a) |\ a\in V\} . The open neighbor of the node subset S is denoted by N(S)=\{b\in V-S\ | \ a\in V(S) and (a, b)\in E\} . The closed neighbor of S is denoted by N[S]=N(S)\cup S . The subgraph induced by S of G , denoted by G[S] , is the graph with the node set S and the edge set \{(a, b)\ |\ a, b\in V(S) and (a, b)\in E\} . The girth of the graph G is the smallest cycle length, denoted by g(G) . The test result between any two nodes a and b is called syndrome of edge (a, b) , which is represented by \delta(a, b)\in\{0,1\} . In the PMC model, if the tester a is a fault-free node, \delta(a, b)=0 represents that node b is diagnosed as a fault-free node, and \delta(a, b)=1 represents that node b is diagnosed as a faulty node. If the tester a is a faulty node, then \delta(a, b)=0 or \delta(a, b)=1 , which represents that node b is diagnosed as a fault-free node or a faulty node, as shown in Table 1. For convenience, we let \Gamma(a)=\left\{b\in N(a)|\delta(a, b) = 0 \right\}.
In probabilistic fault diagnosis, the fault-free node a is denoted by a^{+} , the faulty node a is denoted by a^{-} , and the suspicious node a is denoted by a^{0} . We assume that each node has the same fault-free probability p , and the nodes are independent for each other, no matter whether they are fault-free or not. The probability that node a is fault-free is recorded as P_{a^{+}} , and the probability that node a is faulty is recorded as P_{a^{-}} . Thus, P_{a^{+}}=p and P_{a^{-}}= 1- P_{a^{+}}= 1-p . If \delta(a, b)=0 (resp., 1), then a is matched to b (resp., a is not matched to b ). P_{\delta(a,\ b)} represents the probability of edge (a, b) , indicating whether node a is matched to node b or not. P_{c}(a) (resp., P_{w}(a) ) indicates the probability that the node a is correctly (resp., wrongly) diagnosed. Next, we will introduce several prior probabilities and give the probabilistic PMC model, as shown in Table 2.
Table 2. Probabilistic PMC ModelTester a Testee b \delta(a, b) Fault-free Fault-free 0 (P_{\delta(a^{+},\ b^{+})}=1) Fault-free Faulty 0 (P_{\delta(a^{+}, \ b^{-})} = 1 - \gamma) or 1 (P_{\delta( a^{+},\ b^{-} )}=\gamma) Faulty Fault-free 0 (P_{\delta(a^{-},\ b^{+})} = 1 - \gamma) or 1 (P_{\delta(a^{-},\ b^{+})}=\gamma) Faulty Faulty 0 (P_{\delta(a^{-},\ b^{-})} = \beta) or 1 (P_{\delta(a^{-},\ b^{-})} = 1 - \beta) Note: The state of a node is “fault-free” means that thisnode can work normally, whereas that the state of a node is“faulty” means that this node cannot work normally. For a^{+} and b^{+} , we suppose
P\{\delta(a, b)=0\ |\ a^+, b^+\}=1. For a^{+} and b^{-} (or, a^{-} and b^{+} ), we suppose
\begin{split} P\{\delta(a, b)=1\ |\ a^+, b^-\}=P\{\delta(a, b)=1\ |\ a^-, b^+\} = \gamma, \end{split} \begin{split} &P\{\delta(a, b)=0\ |\ a^+, b^-\}=\\ & P\{\delta(a, b)=0\ |\ a^-, b^+\} = 1-\gamma. \end{split} For a^{-} and b^{-} , we suppose
\begin{array}{l} P\{\delta(a, b)=0 \ |\ a^-, b^-\}=\beta, \\ P\{\delta(a, b)=1 \ |\ a^-, b^-\}=1-\beta. \end{array} In fact, with the increasing number of nodes, \beta approaches to 0 and \gamma approaches to 1.
3. Local Fault Diagnosis Algorithm of General Graphs
In this section, we propose a new local diagnosis algorithm for general graphs with girth no less than 6, which improves the algorithms in [17, 18].
Huang et al.[17] presented a local fault diagnosis algorithm with the threshold k=2 , which claims that all nodes in a connected subgraph are regarded as fault-free nodes while the other nodes are regarded as faulty nodes.
Definition 1[17]. For a simple and undirected graph G=(V, E) and S\subseteq V , S forms a faction if it satisfies the following three conditions.
1) G[S] is a connected subgraph.
2) For every edge (a, b)\in G[S] , \delta(a, b)=0 .
3) For every node a\in S and every node b\in N(a) -S , \delta(a, b)=1 .
Claim 1[17]. Every fault-free node (or, faulty node) is always in a faction.
In fact, we can measure the state of nodes in a faction by the threshold k . If the size of a faction exceeds k , then every node in the faction is fault-free, that is to say, the faction is deemed as a really fault-free component (i.e., the component in which all the nodes are fault-free); otherwise the faction is a faulty component (i.e., the component in which there exists at least one faulty node). Clearly, for any suspicious node a , if a belongs to a faction whose size is more than k , then a is diagnosed as a fault-free node. Hence, we propose Algorithm 1 to diagnose the states of the local nodes in G for k=3 , and we further give the correctness proof and time complexity of Algorithm 1 by Theorem 1.
Theorem 1. Any suspicious node a is diagnosed as a faulty node by Algorithm 1 if and only if node a belongs to a faction whose number of nodes is no more than 3, and the time complexity of Algorithm 1 is O(\Delta) , where \Delta is the maximum degree of G .
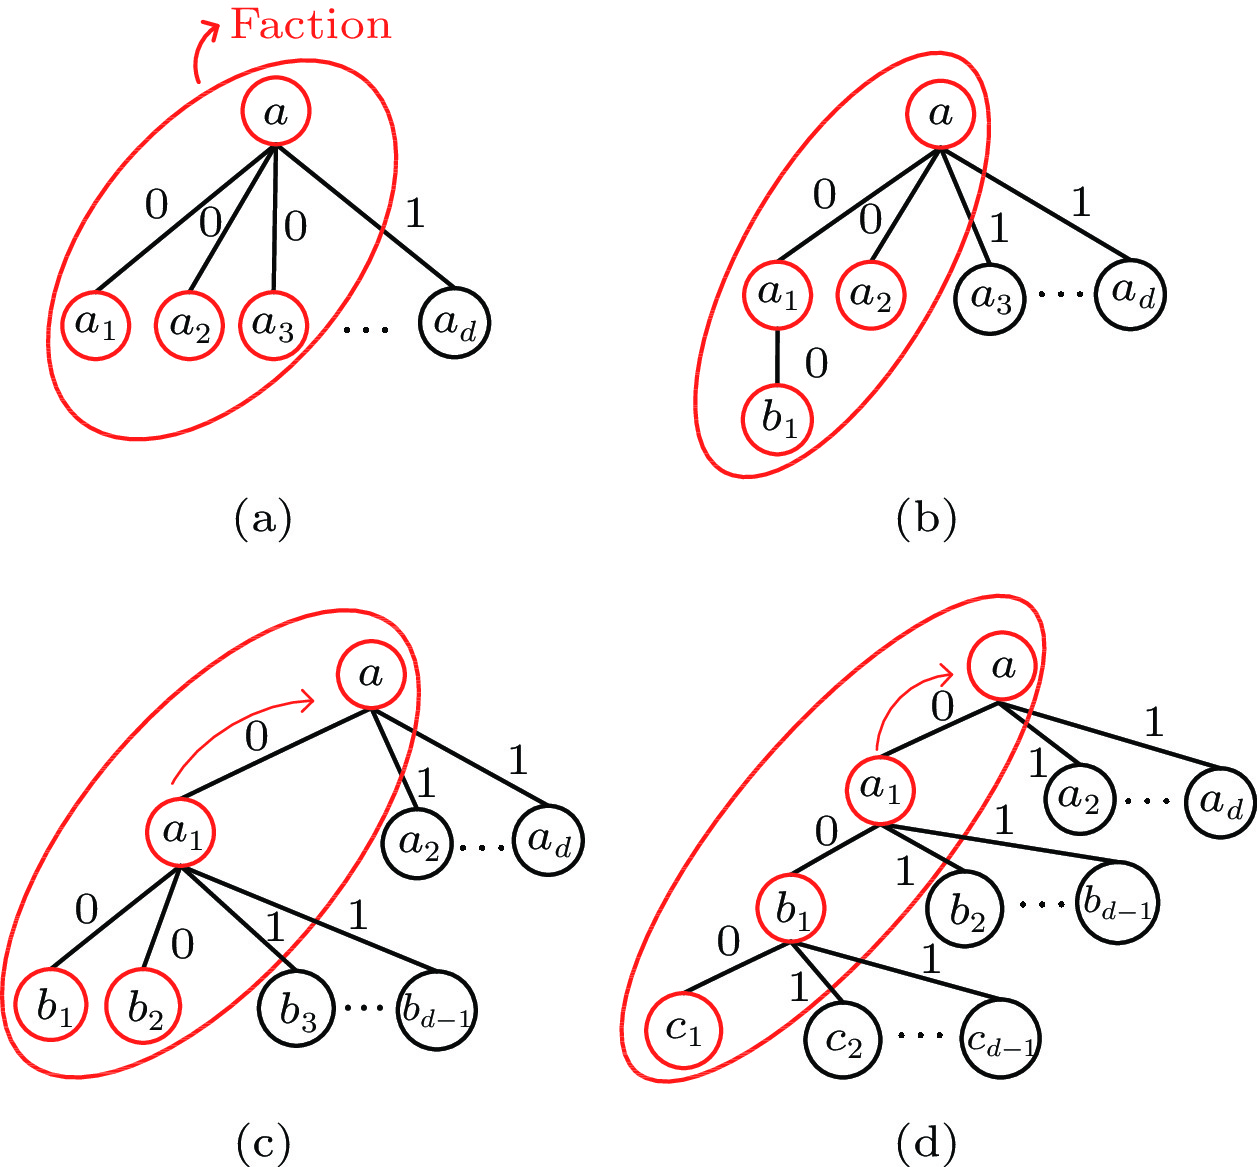
Proof. Necessity. Suppose that node a is in the faction whose number of nodes is greater than 3. Then, node a satisfies one of the following cases: node a has at least three matching neighbors in the faction, or node a has two matching neighbors, one of which has another matching neighbor except a , or node a has just one matching neighbor, which has at most two matching neighbors except a in the faction. This implies that node a must meet any one of the four cases in Fig.1. Thus, a will be diagnosed as a fault-free node through lines 3–34 of Algorithm 1.
![]() Figure 1. Four cases in which node a is diagnosed as a fault-free node for k > 3. (a) a has more than three matching neighbors. (b) a has two matching neighbors. (c) a has exactly one matching neighbor, which has at least three matching neighbors. (d) a has exactly one matching neighbor, which has two matching neighbors.
Figure 1. Four cases in which node a is diagnosed as a fault-free node for k > 3. (a) a has more than three matching neighbors. (b) a has two matching neighbors. (c) a has exactly one matching neighbor, which has at least three matching neighbors. (d) a has exactly one matching neighbor, which has two matching neighbors.Sufficiency. If node a belongs to a faction whose number of nodes is less than or equal to 3, then |\Gamma(a)|\leqslant2 . In other words, node a has at most two matching neighbors in the same faction, say a_{1} and a_{2} . Since a_{1} and a_{2} are the merely two neighbors in the faction, they cannot be diagnosed by line 9 in Algorithm 1. If node a has exactly one matching neighbor a_{1} for k\leqslant 2, there are at most three nodes a , a_{1} and b_{1} in the same faction, which cannot be diagnosed by line 17 and line 22 in Algorithm 1. As a result, the above conditions do not meet any case in Fig.1. In addition, if node a does not have a matching neighbor, it is diagnosed as a faulty node by line 36 in Algorithm 1. Therefore, a is diagnosed as faulty.
Algorithm 1. {\mathtt{Local{\text{-}}Fault{\text{-}}Diagnosis}} Input: graph G=(V, E), the syndrome \delta Output: a fault-free node set T, a faulty node set F 1: (Initialization) Select node a\in V; 2: if there is a node b\in N(a) satisfying \delta(a,b)=0 then 3: if |\Gamma(a)|\geqslant3 then 4: T\leftarrow\Gamma(a)\cup\{a\}; 5: else 6: if |\Gamma(a)|=2 then 7: Suppose \Gamma(a)=\{a_{1}, a_{2}\}; 8: if there is i\in \{1, 2\} satisfying |\Gamma (a_{i}) - \{a\}| \geqslant 1 then 9: T\leftarrow\Gamma(a)\cup\Gamma(a_{i}); 10: else 11: F\leftarrow\Gamma(a)\cup\{a\}; 12: end if 13: else 14: if |\Gamma(a)|=1 then 15: Suppose \Gamma(a)=\{a_{1}\}; 16: if |\Gamma(a_{1})-\{a\}|\geqslant2 then 17: T\leftarrow\Gamma(a_{1})\cup\{a_{1}\}; 18: else 19: if |\Gamma(a_{1})-\{a\}|=1 then 20: Suppose \Gamma(a_{1})-\{a\}=\{b_{1}\}; 21: if |\Gamma(b_{1})-\{a_{1}\}|\geqslant1 then 22: T\leftarrow\Gamma(a_{1})\cup\Gamma(b_{1}); 23: else 24: F\leftarrow\Gamma(a_{1})\cup\{a_{1}\}; 25: end if 26: else 27: F\leftarrow \{a, a_{1}\}; 28: end if 29: end if 30: else 31: F\leftarrow \{a\}; 32: end if 33: end if 34: end if 35: else 36: F\leftarrow \{a\}; 37: end if 38: return T, F; In the following, we analyze the time complexity of Algorithm 1.
If node a is a suspicious node in graph G , we can conduct diagnosis according to the faction with k=3 . To be exact, the time complexity mainly depends on the execution of Algorithm 1 (lines 14–29). In lines 14, 16, 19, and 21, all neighbors of node a in G are diagnosed and the number of tests is at most \Delta(G) . Thus, the time complexity of these lines (lines 14, 16, 19, and 21) is at most O(\Delta) . The time complexity of the remaining steps is O(1) . Therefore, the total time complexity of Algorithm 1 is O(\Delta) .
□ In summary, Algorithm 1 adopts the breadth first search strategy, and its main idea is to introduce a threshold k to quantify the reliability of faction. If the size of a faction is greater than or equal to k , then all nodes in this faction are truly fault-free nodes; otherwise, all nodes are considered to be faulty nodes. Based on Claim 1 and Theorem 1, determining the state of a node only requires considering the size of the faction in which the node is located. In fact, it is enough to diagnose a node and its neighbors for general graphs with girth no less than 6 (in other words, the number of common nodes between any two non-adjacent nodes in the faction is at most 1) by Algorithm 1.
4. Local Performance Analysis of General Regular Graphs
In this section, we will supply the local fault diagnosis of the d -regular and d -connected graph {\cal{G}} ( d is a positive integer) and afford the probability that any node is correctly diagnosed, provided that the threshold does not exceed 3. Recalling the previous notations, P_{a^{+}}=p (resp., P_{a^{-}}=1-p ), where P_{a^{+}} (resp., P_{a^{-}} ) is the probability that a is a fault-free node (resp., a faulty node). Let P_{c}(a^{+}) (resp., P_{c}(a^{-}) ) be the probability that a^{+} (resp., a^{-} ) is correctly diagnosed and P_{w}(a^{+}) (resp., P_{w}(a^{-}) ) be the probability that a^{+} (resp., a^{-} ) is wrongly diagnosed, where a is a node of {\cal{G}} .
Note that P_{c}(a^{+})=1-P_{w}(a^{+}) . If we want to calculate the probability that the fault-free node a is correctly diagnosed, the key is to compute P_{w}(a^{+}) . According to the properties of {\cal{G}} and Algorithm 1, if a is a fault-free node, we can list eight cases such that a is diagnosed as a faulty node, provided that node a belongs to a faction with k\leqslant 2. This implies that P_{w}(a^{+})=\sum\nolimits^{8}_{i=1}P_{w}^{i}(a^{+}) , where P_{w}^{i}(a^{+}) denotes the probability of the local state-syndrome pattern such that a is diagnosed as a faulty node. Furthermore, we introduce the following symbols: N_{{\cal{G}}}(a)=\{a_1, a_2, \ldots, a_{d}\}, N_{{\cal{G}}}(a_{i})=\{b_1, b_2, \ldots, b_{i-1}, a, b_{i+1}, \ldots, b_{d}\}, L = \left\{1, \right. \left. 2,\ldots d\right\}= \langle d\rangle, \ M=\langle d\rangle \setminus \{i\},\ N=\langle d\rangle \setminus \{j\},\ K=\langle d\rangle \setminus \{i,\, j\}, and P_{a_{K}}=\prod\limits_{k\in K}P_{a_{k}}.
In what follows, we will determine the probability that node a is wrongly diagnosed by calculating P^{1}_{w}(a^{+}),P^{2}_{w}(a^{+}),\ldots , and P^{8}_{w}(a^{+}) , respectively.
Lemma 1. P^{1}_{w}(a^{+})=(1-p)^{d}\gamma^{d}.
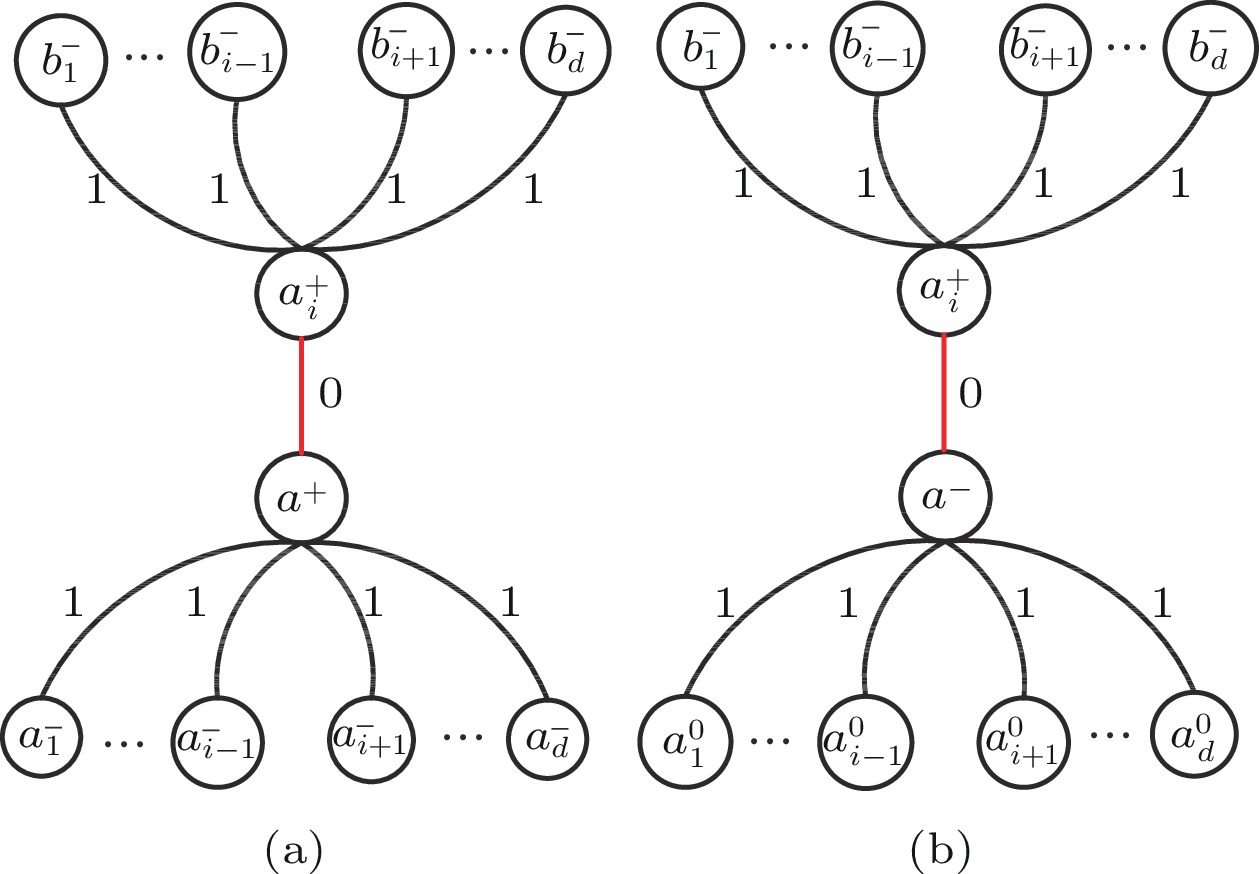
Proof. In the local-syndrome pattern of case 1 (see Fig.2(a)), a^{+} is surrounded by d mismatching faulty neighbors a^{-}_{1}, a^{-}_{2}, \ldots, a^{-}_{d} .
Hence, we have
\begin{aligned} & P_{a^-_i}=1-p,\\&P\{\delta(a, a_i)=1\ |\ a^+, a_i^-\}=\gamma, \end{aligned} for any i\in L=\{1,2,\ldots, d\} .
Thus,
\begin{aligned}& P_{a^-_L}=(1-p)^{d},\\&P_{\delta(a^+,\ a^-_L)}=P\{\delta(a,\ a_L)=1 \ |\ a^+, a_L^-\}=\gamma^{d}. \end{aligned} Then, the probability of occurrence for case 1 is
P^{1}_{w}(a^+)=P_{a^-_L}P_{\delta(a^+,\ a^-_L)}= (1-p)^{d}\gamma^{d}. Lemma 2. P^{2}_{w}(a^{+})=dp(1-p)^{2d-2}\gamma^{2d-2}.
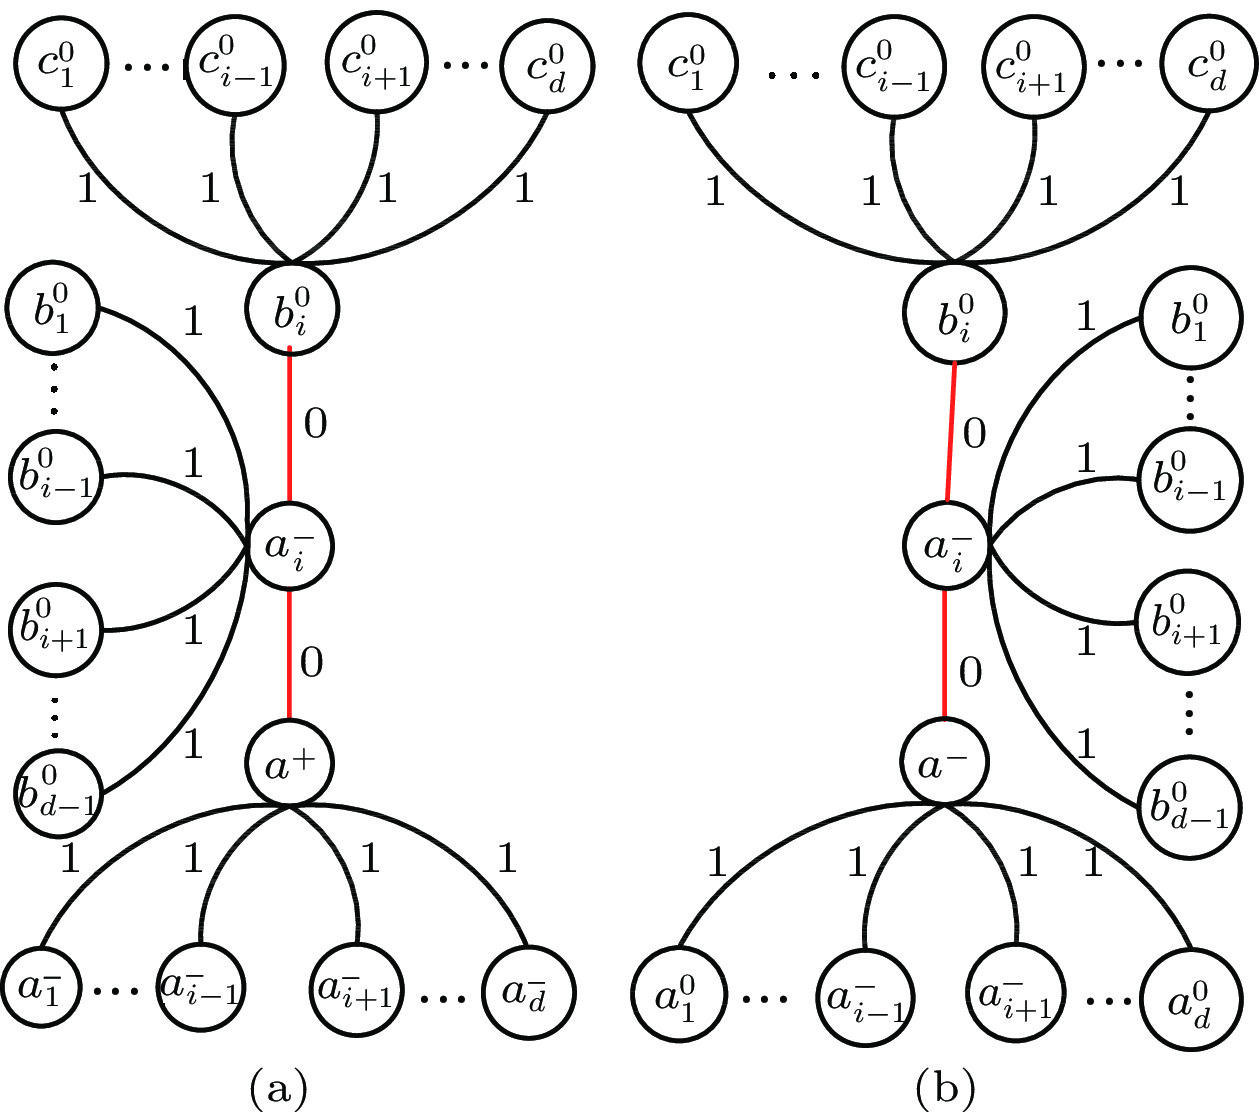
Proof. In the local-syndrome pattern of case 2 (see Fig.3(a)), node a^{+} is surrounded by d-1 mismatching faulty neighbors except a_i^{+} .
By Lemma 1, it is easy to see
P_{a^-_M}P_{\delta(a^+,\ a^-_M)}=(1-p)^{d-1}\gamma^{d-1}, P_{b^-_M}P_{\delta(a^+_i,\ b^-_M)}=(1-p)^{d-1}\gamma^{d-1}. Since a_i has d choices, the probability of occurrence for this fault pattern is
\begin{split} P^{2}_{w}(a^+)=&\ dP_{a^-_M}P_{\delta(a^+,\ a^-_M)}P_{a^+_i}P_{\delta(a^+,\ a^+_i)}P_{b^-_M}P_{\delta(a^+_i,\ b^-_M)} \\=&\ d(1-p)^{d-1}\gamma^{d-1}p(1-p)^{d-1}\gamma^{d-1} \\=&\ dp(1-p)^{2d-2}\gamma^{2d-2}. \qquad\qquad\qquad\qquad\qquad\qquad\square\end{split} Lemma 3. P^{3}_{w}(a^{+})=d(1-\gamma)\gamma^{d-1}\theta^{d-1}(1-p)^{d} .
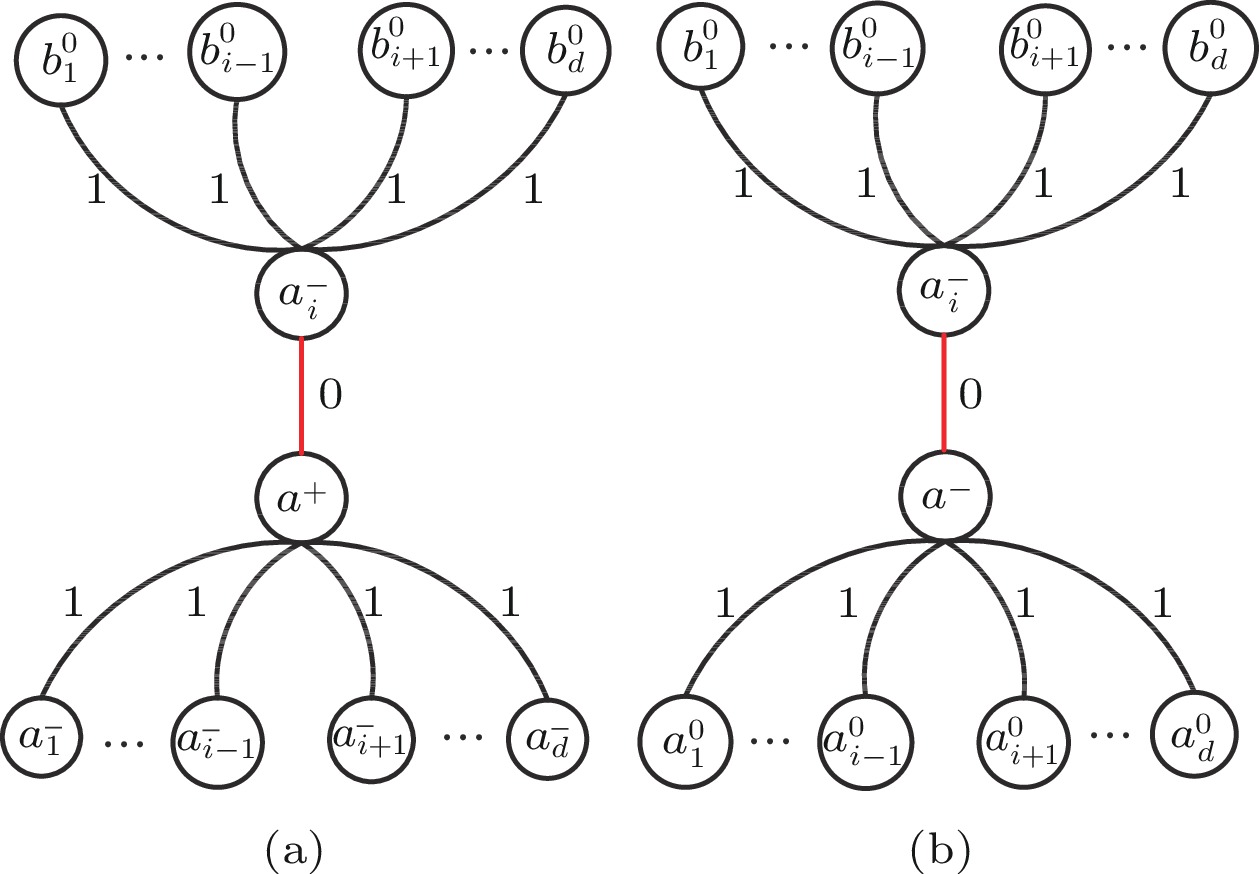
Proof. In the local-syndrome pattern of case 3 (see Fig.4(a)), the node a^{+} is surrounded by d-1 mismatching faulty neighbors except a_i^{-} .
Clearly, P_{a^{-}_M}P_{\delta(a^{+},\ a^{-}_M)}=(1-p)^{d-1}\gamma^{d-1}. In addition, for any suspicious node b^{0}_j\in b^{0}_M , since b_j^{+} and b_j^{-} are independent, we have
\begin{split}& P\{b^{0}_j,\delta(a_i, b_j)= 1 \ |\ a_i^-\}\\=\ & P\{b_j^+,\delta(a_i, b_j)=1 \ |\ a_i^-\}+P\{b_j^-,\delta(a_i, b_j)=1 \ |\ a_i^-\}\\=\ & P_{b_j^+}P\{\delta(a_i, b_j)=1 \ |\ a_i^-\}+P_{b_j^-}P\{\delta(a_i, b_j)= 1 \ |\ a_i^-\}\\=\ & p\gamma+(1-p)(1-\beta). \end{split} Letting \theta=p\gamma+(1-p)(1-\beta) , we have
\begin{split}&P_{b^{0}_M}P_{\delta(a^-_i,\ b^{0}_M)}=\theta^{d-1}, \\& P_{\delta(a^+,\ a^-_i)}=P\{\delta(a, a_i)=0 \ |\ a^+, a_i^-\} =1-\gamma. \end{split} By the arbitrariness of a_i , the probability of occurrence for this fault pattern is
\begin{split} P^{3}_{w}(a^+)=\ &dP_{a^-_M}P_{\delta(a^+,\ a^-_M)}P_{a^-_i}P_{\delta(a^+,\ a^-_i)}P_{b^{0}_M}P_{\delta(a^-_i,\ b^{0}_M)} \\=\ &d(1-\gamma)\gamma^{d-1}\theta^{d-1}(1-p)^{d}. \qquad\qquad\qquad\qquad\quad\square \end{split} Lemma 4. P^{4}_{w}(a^{+})=d(d-1)p(1-p)^{2d-2} \gamma^{2d-3} \times \left(p (1-p)^{d-2} \gamma^{d-1}+ \theta^{d-1}(1-\gamma)\right) .
Proof. For the local-syndrome pattern of case 4 (see Fig.5(a)), we first need to discuss the probability of b_{i} in different situations.
If b_{i} is a fault-free node, then the nodes surrounding it are faulty nodes except a_{i} . The probability that b^{+}_{i} is surrounded by d-1 mismatching faulty neighbors is
P_{c^-_M}P_{\delta(b^+_{i},\ c^-_M)}=(1-p)^{d-1}\gamma^{d-1}. If b_{i} is a faulty node, then the nodes surrounding it are suspicious nodes except a_{i} . The probability that b^{-}_{i} is surrounded by d-1 mismatching suspicious neighbors is
P_{c^{0}_M}P_{\delta(b^-_{i},\ c^{0}_M)}=\theta^{d-1}. Therefore,
\begin{split} P_{b_{i}^{0}}=\ &P_{c^-_M}P_{\delta(b^+_{i},\ c^-_M)}+P_{c^{0}_M}P_{\delta(b^-_{i},\ c^{0}_M)}\\=\ &(1-p)^{d-1}\gamma^{d-1}+\theta^{d-1}. \end{split} Next, since the node a_{i} is surrounded by d-2 mismatching faulty nodes except a^{+} and b_{i}^{0} , we have
\begin{split} P_{a_{i}^+}=\ &P_{b_{K}^-}P_{\delta(a^+_{i},\ b^-_{K})}P_{b_{i}^{0}}P_{\delta(a^+_{i},\ b^{0}_{i})}\\=\ &(1-p)^{d-2}\gamma^{d-2} \big(p\big(1-p\big)^{d-1}\gamma^{d-1}+\\ & \theta^{d-1}(1-p)(1-\gamma)\big). \end{split} Then, we compute the probability of the fault-free node a being misdiagnosed. Since node a is surrounded by one matching fault-free node a_{i} and d-1 mismatching faulty nodes, we have
\begin{split} P_{w}(a^+)=\ &P_{a_{M}^-}P_{\delta(a^+,\ a^-_{M})}P_{a_{i}^+}P_{\delta(a^+,\ a^+_{i})}\\ =\ & (1-p)^{d-1}\gamma^{d-1}p(1-p)^{d-2}\gamma^{d-2}\\&(p(1 - p)^{d - 1} \gamma^{d-1}+\theta^{d-1}(1-p)(1-\gamma))\\ = \ &p(1 - p)^{2d - 2}\gamma^{2d - 3}(p(1 - p)^{d - 2}\gamma^{d - 1}+\theta^{d - 1}(1- \gamma)). \end{split} Owing to the arbitrariness of choosing a_{i} and b_{i} , we have P^{4}_{w}(a^{+})=d(d-1)p(1-p)^{2d-2}\gamma^{2d-3}\left(p(1-\right. \left.p)^{d-2}\right.{\gamma^{d-1}}+\theta^{d-1}(1-\gamma)).
□ Lemma 5. P^{5}_{w}(a^{+})=d(d-1) (1-\gamma) \gamma^{d-1} \theta^{d-2}\left(1- \right.\left. p\right)^{d+1} (p(1-p)^{d-2} (1-\gamma)\gamma^{d-1}+\theta^{d-1}\beta).
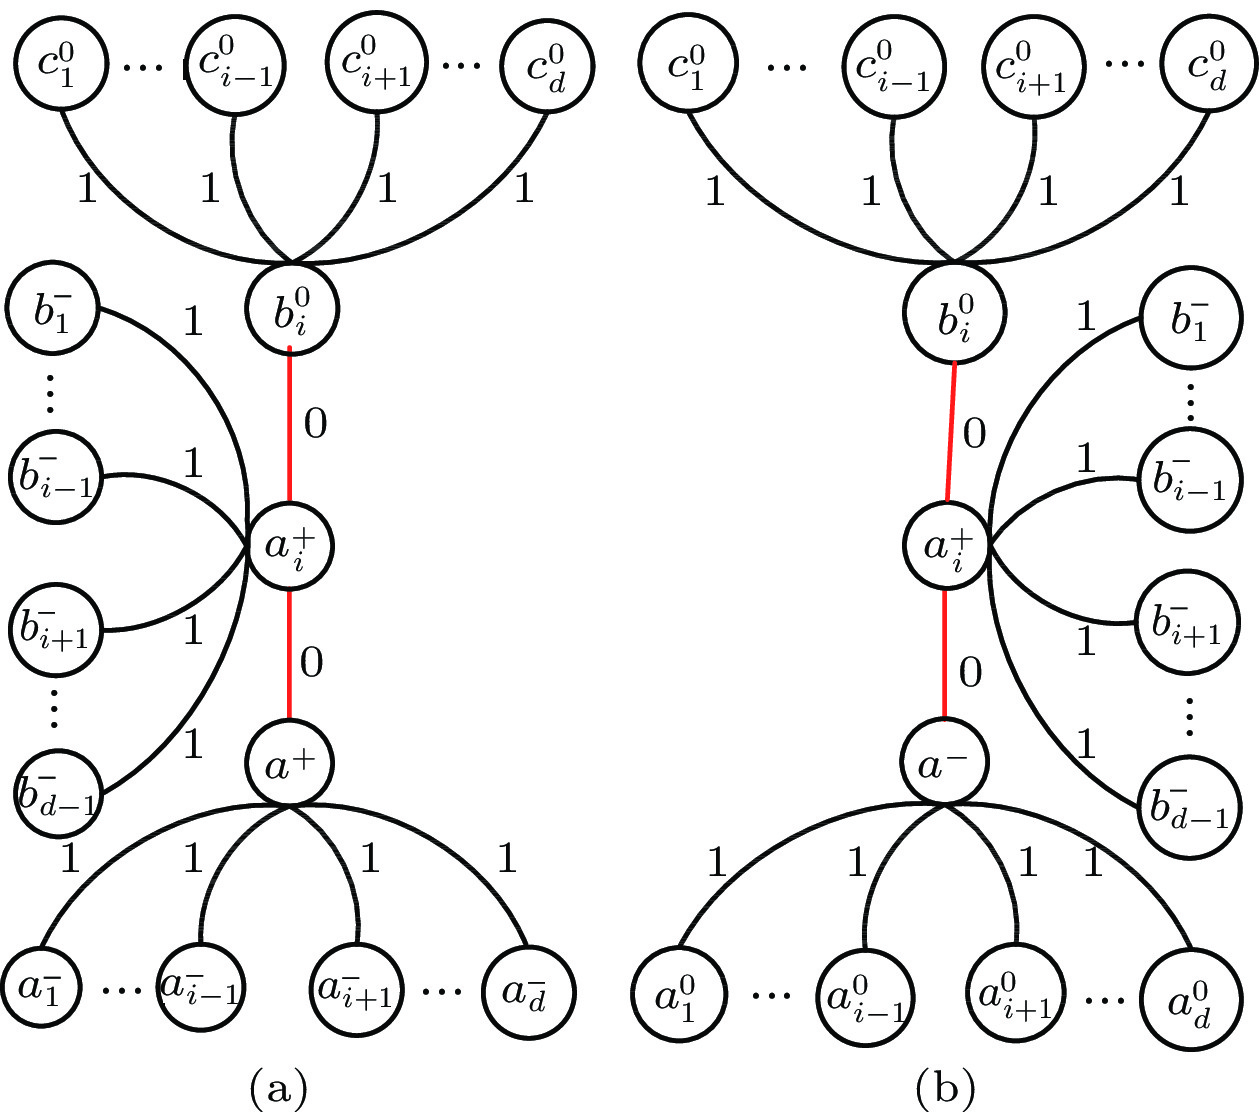
Proof. In the local-syndrome pattern of case 5 (see Fig.6(a)), by Lemma 4, we have
P_{b_{i}^{0}}=(1-p)^{d-1}\gamma^{d-1}+\theta^{d-1}. Because node a_{i} is surrounded by d-2 mismatching suspicious nodes except a^{+} and b_{i}^{0} ,
\begin{split} P_{a_{i}^-}=\ &P_{b_{K}^{0}}P_{\delta(a_{i}^-,\ b_{K}^{0})}P_{b_{i}^{0}}P_{\delta(a_{i}^-,\ b_{i}^{0})}\\ = \ & \theta^{d-2}((1-p)^{d-1}\gamma^{d-1}p(1-\gamma)+\theta^{d-1}(1-p)\beta). \end{split} Since node a is surrounded by one matching faulty node a_{i} and d-1 mismatching neighbors, we have
\begin{split}P_{w}(a^+)=\ &P_{a_{M}^-}P_{\delta(a^+,\ a_{M}^-)}P_{a_{i}^-}P_{\delta(a^+,\ a_{i}^-)}\\ =\ & (1 - p)(1 - \gamma)\theta^{d-2}(1 - p)^{d-1}\gamma^{d-1}(p(1-\\& \gamma)\gamma^{d-1}(1-p)^{d-1}+ \theta^{d-1}(1-p)\beta) \\= \ &\gamma^{d-1}(1-\gamma)\theta^{d-2}(1-p)^{d+1}(p(1-p)^{d-2}(1-\\&\gamma) \gamma^{d-1}+ \theta^{d-1}\beta). \end{split} Furthermore, we have
\begin{split}P^{5}_{w}(a^+)=&d(d-1)(1-\gamma)\gamma^{d-1}\theta^{d-2}(1-p)^{d+1}(p(1- \\& p)^{d-2}(1-\gamma)\gamma^{d-1}+\theta^{d-1}\beta).\qquad\qquad\qquad\qquad\square \end{split} Lemma 6. P^{6}_{w}(a^{+})=\binom{d}{2}p^{2}(1-p)^{3d-4}\gamma^{3d-4}.
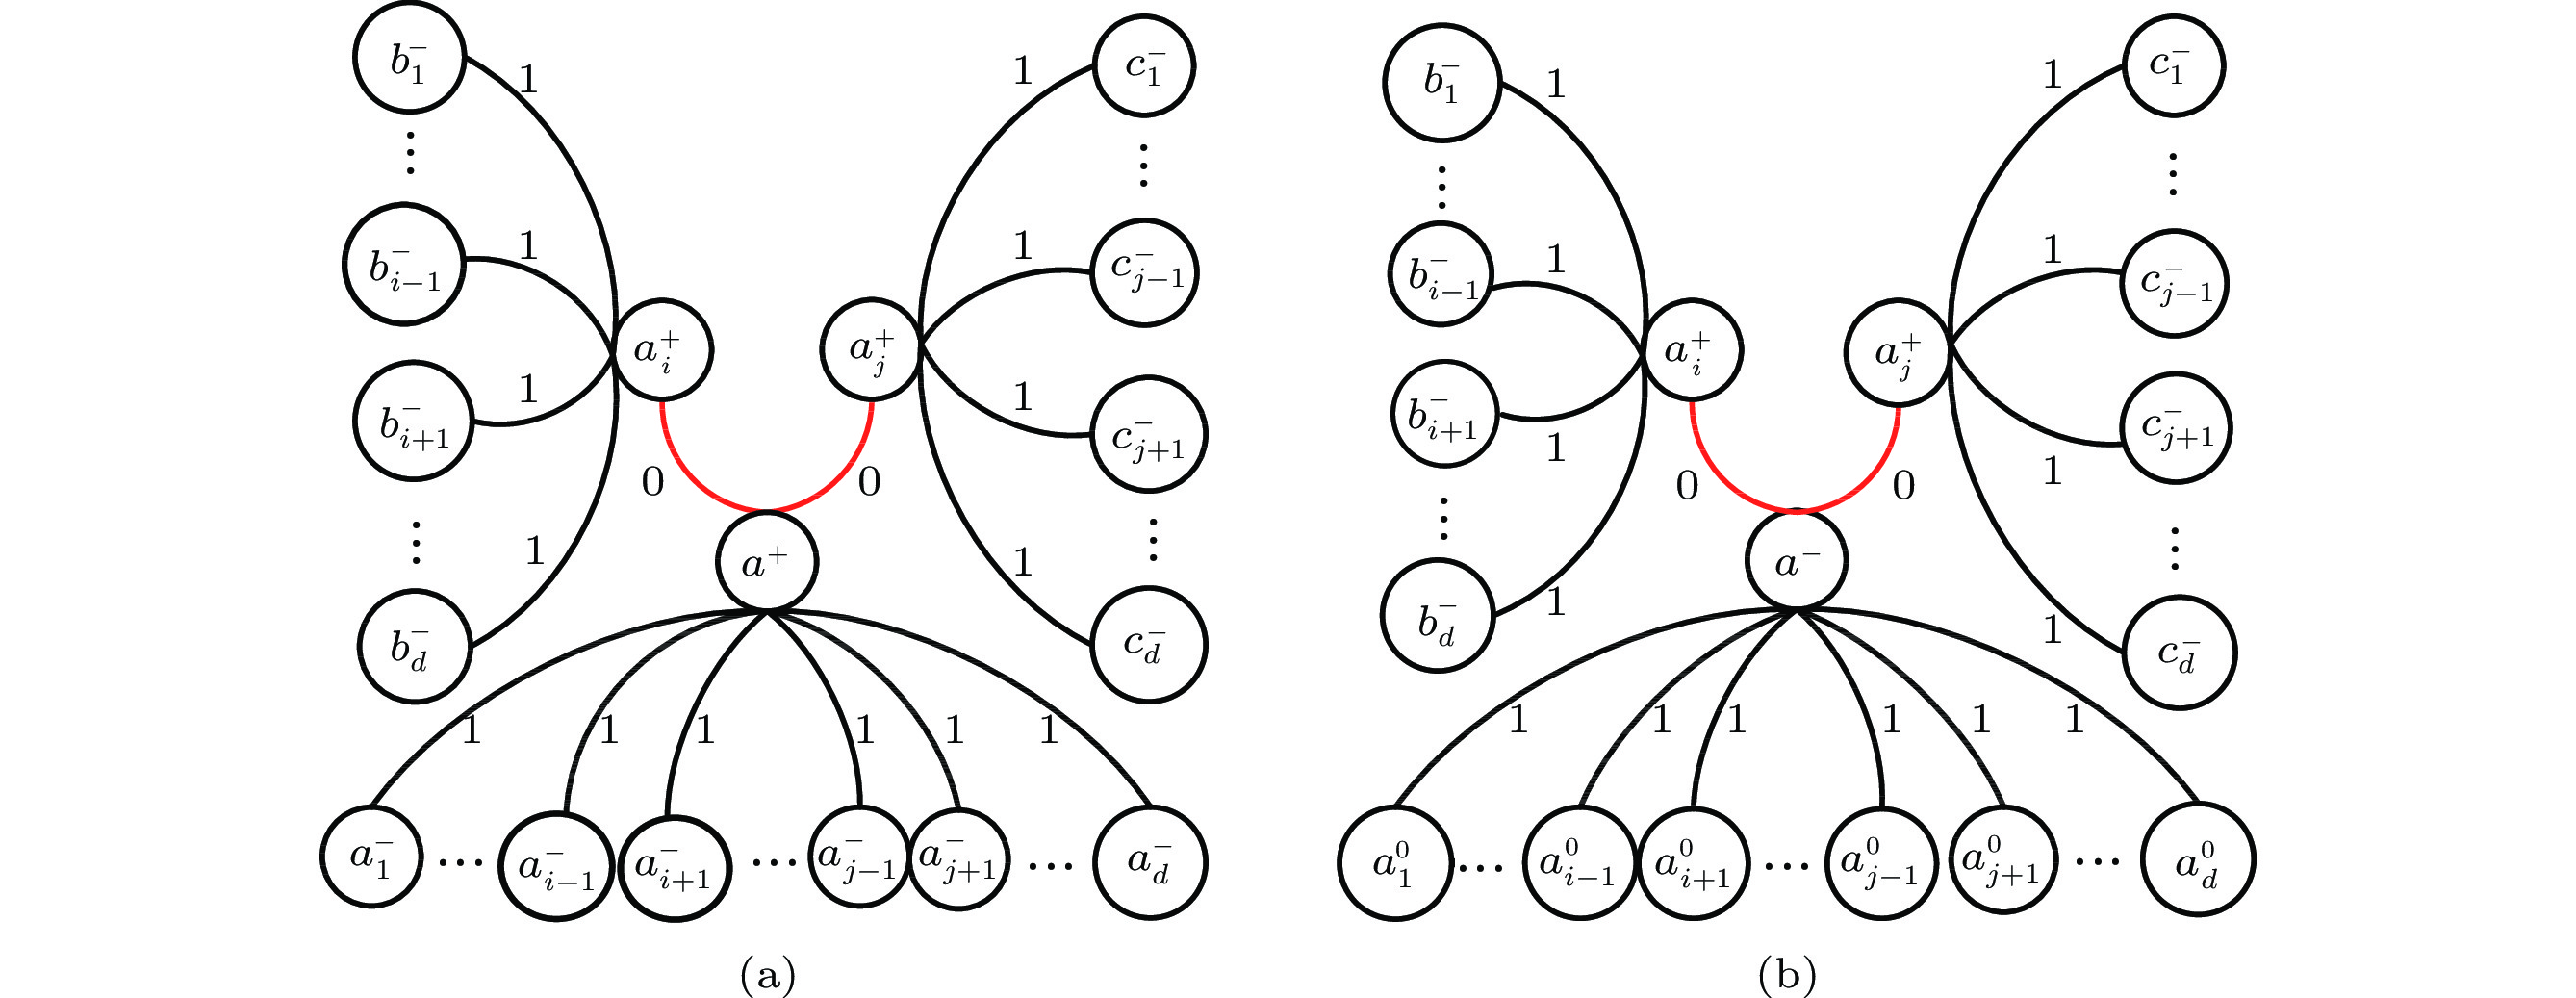
Proof. In the local-syndrome pattern of case 6 (see Fig.7(a)), a^{+} has two matching fault-free neighbors, say a_i^{+} and a_j^{+} . Let the neighbors of a^{+}, a_i^{+} , and a_j^{+} be denoted by a_K^{-}, b_M^{-} , and c_N^{-} , respectively.
Clearly,
P_{\delta(a^+,\ a^+_i)}=P\{\delta(a, a_i)=0 \ |\ a^+,\ a_i^+\}=1, P_{\delta(a^+,\ a^+_j)}=P\{\delta(a,\ a_j)=0 \ |\ a^+,\ a_j^+\}=1. By Lemma 2, we have
\begin{array}{l} P_{a^-_K}P_{\delta(a^+,\ a^-_K)}=(1-p)^{d-2}\gamma^{d-2}, \\ P_{b^-_M}P_{\delta(a^+_i,\ b^-_M)}=P_{c^-_N}P_{\delta(a^+_j,\ c^-_N)}=(1-p)^{d-1}\gamma^{d-1}. \end{array} Due to the arbitrariness of a_i and a_j , we have
\begin{split} P^{6}_{w}(a^+)=\ &\binom{d}{2}P_{a^-_K}P_{\delta(a^+,\ a^-_K)}P_{a^+_i}P_{\delta(a^+,\ a^+_i)}P_{b^-_M} \ \times\\& P_{\delta(a^+_i,\ b^-_M)}P_{a^+_j}P_{\delta(a^+,\ a^+_j)}P_{c^-_N}P_{\delta(a^+_j,\ c^-_N)} \\ = \ &\binom{d}{2}(1-p)^{d-2}\gamma^{d-2}p(1-p)^{d-1}\gamma^{d-1}\times\\& p(1- p)^{d-1}\gamma^{d-1} \\ = \ &\binom{d}{2}p^{2}(1-p)^{3d-4}\gamma^{3d-4}.\qquad\qquad\qquad\qquad\qquad\square \end{split} Lemma 7. P^{7}_{w}(a^{+} ) = \binom{d}{2}p\theta^{d-1}\gamma^{2d - 3}(1 - \gamma)(1 - p)^{2d-2}.
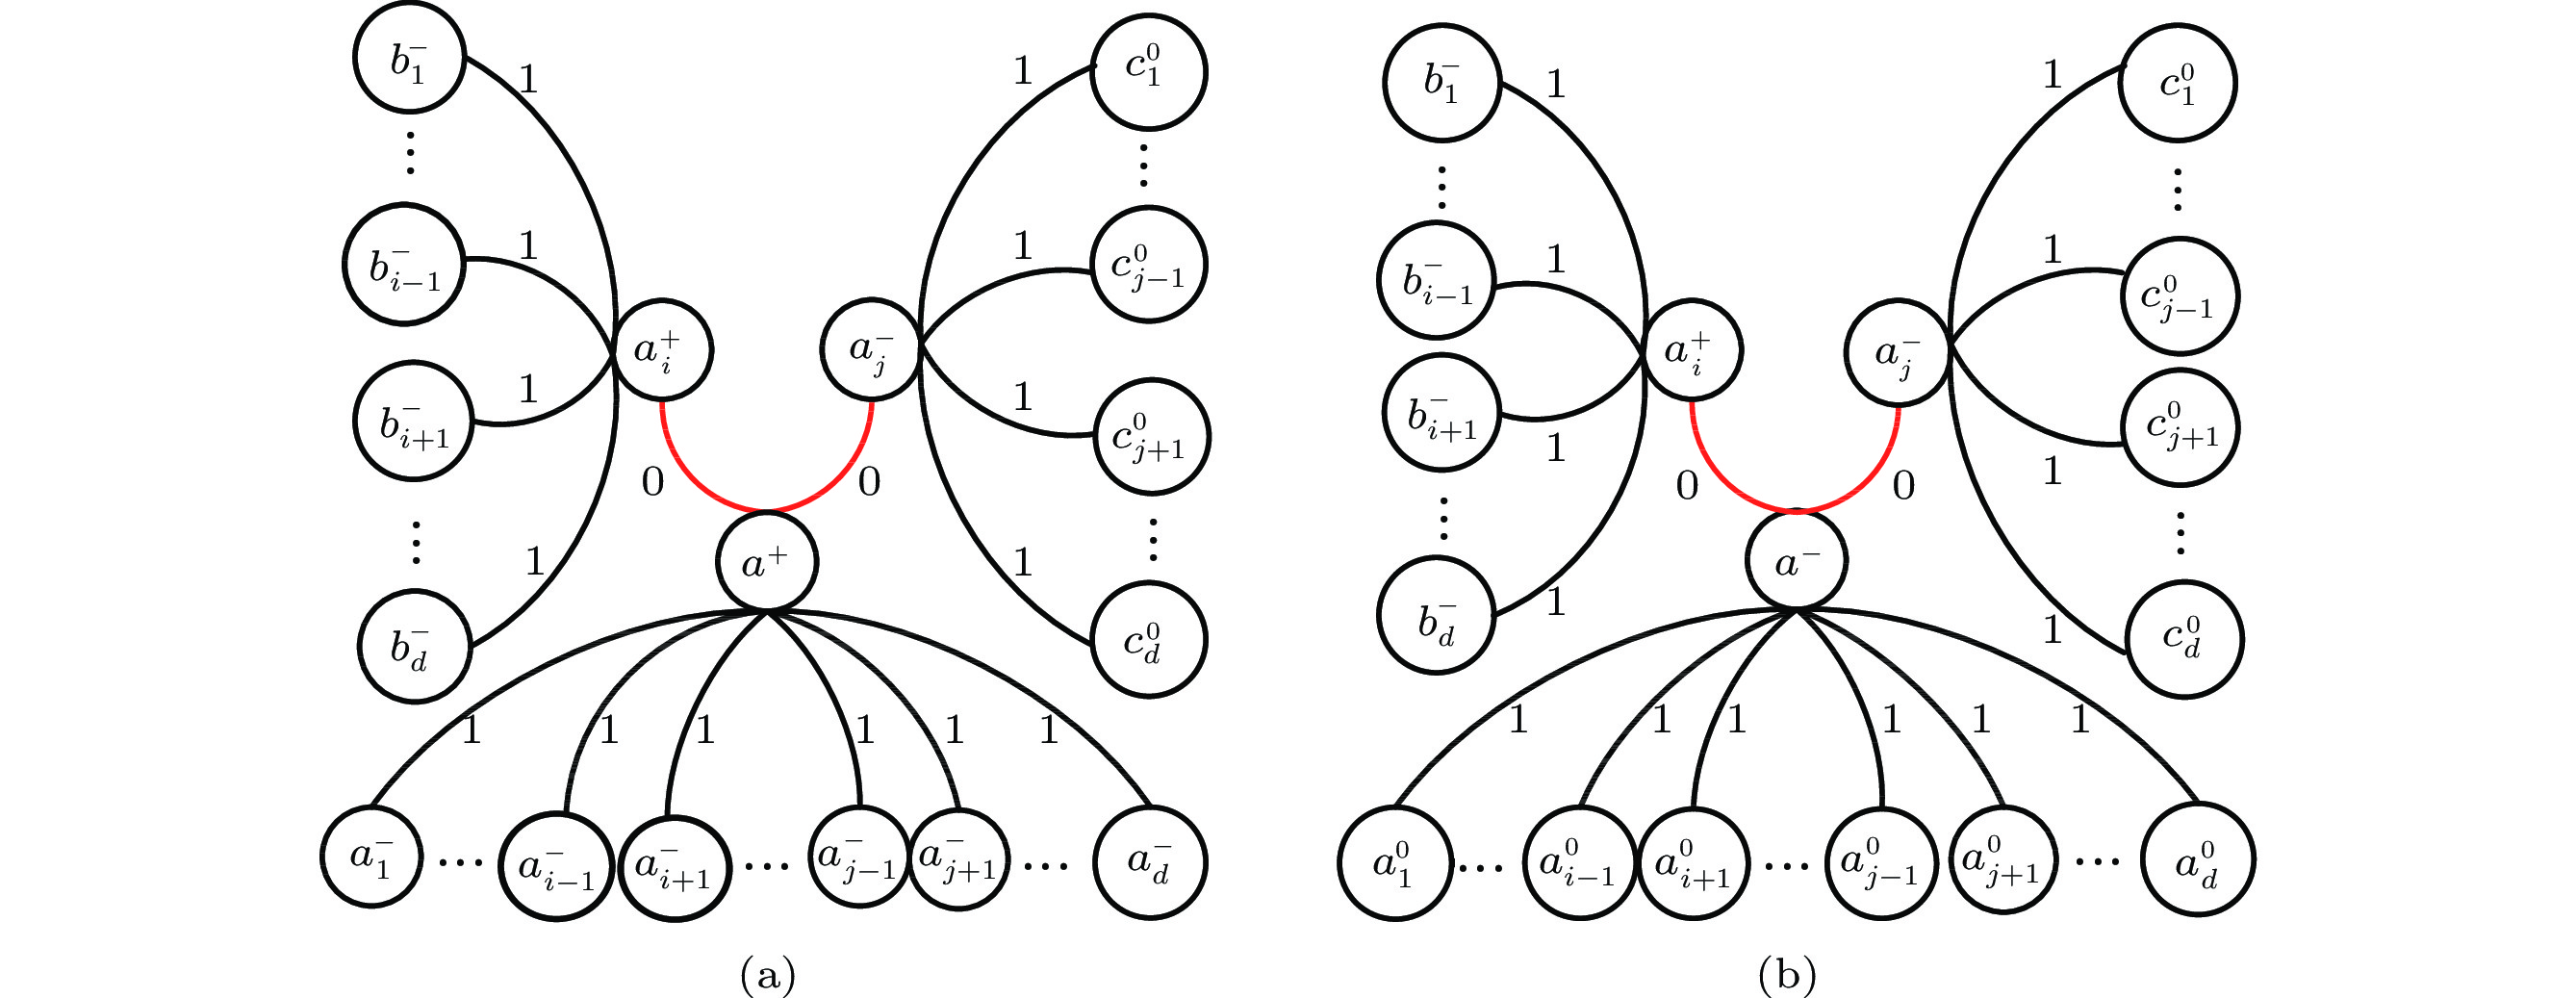
Proof. In the local-syndrome pattern of case 7 (see Fig.8(a)), a^{+} has one matching fault-free neighbor a_i^{+} , and one matching faulty neighbor a_j^{-} . The neighbor nodes of a^{+} and a_i^{+} are a_K^{-} and b_M^{-} respectively, while the neighbors of a_j^{-} are diagnosed as suspicious nodes (fault-free or not), denoted by c_N^{0} .
By Lemma 3 and Lemma 6, it is easy to see
\begin{array}{l}P_{a^-_{K}}P_{\delta(a^+,\ a^-_{K})}=(1-p)^{d-2}\gamma^{d-2}, \\ P_{b^-_{M}}P_{\delta(a^+_{i},\ b^-_{M})}=(1-p)^{d-1}\gamma^{d-1}, \\ P_{c^{0}_N}P_{\delta(a^-_j,\ c^{0}_N)}=\theta^{d-1}. \end{array} Note that
\begin{array}{l}P_{\delta(a^+,\ a^+_i)}=P\{\delta(a,\ a_i)=0 \ |\ a^+,\ a_i^+\}=1, \\ P_{\delta(a^+,\ a^-_j)}=P\{\delta(a,\ a_j)=0 \ |\ a^+,\ a_j^-\}=1-\gamma. \end{array} By the arbitrariness of choosing a_i and a_j , the probability of occurrence for this fault pattern is
\begin{split}P^{7}_{w}(a^+)=\ &\binom{d}{2}P_{a^-_{K}}P_{\delta(a^+,\ a^-_{K})}P_{a^+_i}P_{\delta(a^+,\ a^+_i)}P_{b^-_M}P_{\delta(a^+_i,\ b^-_M)} \,\times\\&P_{a^-_j}P_{\delta(a^+,\ a^-_j)}P_{c^{0}_N}P_{\delta(a^-_j,\ c^{0}_N)} \\= \ & \binom{d}{2}\big(\big.1-\big.p\big)^{d-2}\gamma^{d-2}p(1-p)^{d-1}\gamma^{d-1}\\&\big(\big.1-\big.p\big)(1- \gamma)\theta^{d-1}\\= \ &\binom{d}{2}p(1-\gamma)\big(\big.1-p\big)\big.^{2d-2}\gamma^{2d-3}\theta^{d-1}.\qquad\qquad\square \end{split} Lemma 8. P^{8}_{w}(a^{+}) = \binom{d}{2}\gamma^{d-2}(1 - \gamma)^{2}(1 - p)^{d}\theta^{2d-2} .
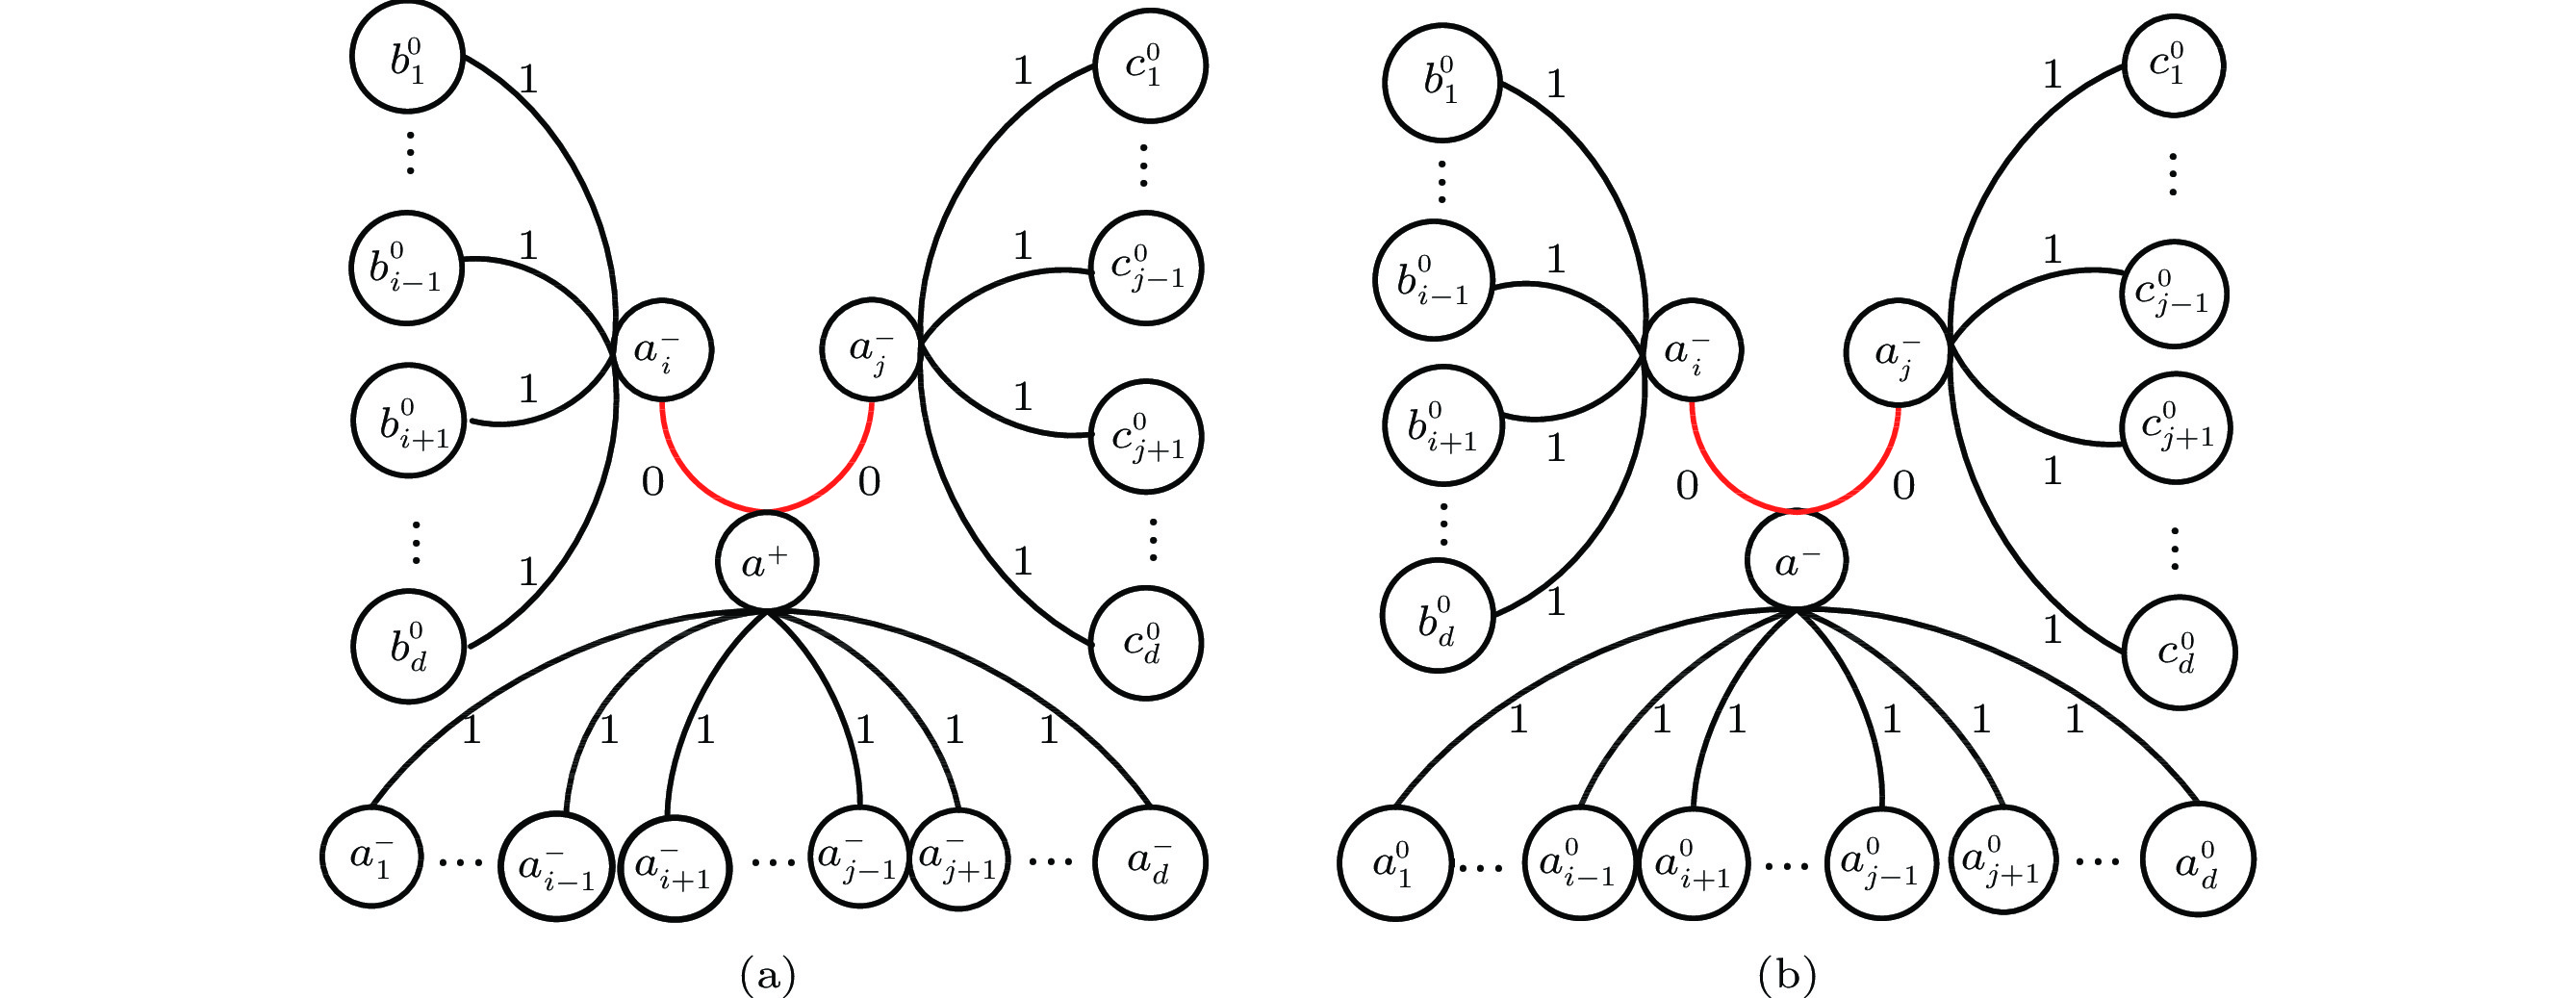
Proof. In the local-syndrome pattern of case 8 (see Fig.9(a)), a^{+} has two matching faulty neighbors, say a_i^{-} and a_j^{-} .
By Lemma 7, it is easy to see
\begin{array}{l} P_{a^-_{K}}P_{\delta(a^+,\ a^-_{K})}=(1-p)^{d-2}\gamma^{d-2},\\ P_{b^{0}_M}P_{\delta(a^-_i,\ b^{0}_M)}=P_{c^{0}_N}P_{\delta(a^-_j,\ c^{0}_N)}=\theta^{d-1}. \end{array} Moreover,
P_{\delta(a^+,\ a^-_i)}=P_{\delta(a^+,\ a^-_j)}=1-\gamma. By the arbitrariness of choosing a_i and a_j , the probability of occurrence for this fault pattern is
\begin{split}P^{8}_{w}(a^+)=\ &\binom{d}{2}P_{a^-_{K}}P_{\delta(a^+,\ a^-_{K})}P_{a^-_i}P_{\delta(a^+,\ a^-_i)}P_{b^{0}_M}P_{\delta(a^-_i,\ b^{0}_M)} \,\times\\& P_{a^-_j}P_{\delta(a^+,\ a^-_j)}P_{c^{0}_N}P_{\delta(a^-_j,\ c^{0}_N)}\\ =\ & \binom{d}{2}\big(\big.1-p\big)^{d-2}\big.\gamma^{d-2}(1-\gamma)\theta^{d-1}\\&(1-p)^{2}(1- \gamma)\theta^{d-1}\\ =\ & \binom{d}{2}\gamma^{d-2}(1-\gamma)^{2}(1-p)^{d}\theta^{2d-2}.\quad\qquad\qquad\;\;\;\;\square \end{split} According to the fact that P_{c}(a^{+})=1-\{P^{1}_{w}(a^{+})+ P^{2}_{w}(a^{+})+...+P^{8}_{w}(a^{+})\}, by Lemmas 1–8, we derive the following theorem.
Theorem 2. For any node a\in V({\cal{G}}) , the probability that the fault-free node a is correctly diagnosed is
\begin{split} P_{c}(a^+)=\;&1-\displaystyle\sum\limits^{8}_{i=1}P^{i}_{w}(a^+) \\=\;&1-\{(1-p)^{d}\gamma^{d}+d(p(1-p)^{2d-2}\gamma^{2d-2}+\\& (1- p)^{d}(1-\gamma)\gamma^{d-1}\theta^{d-1})+d(d-1)\times\\&(p^{2}(1-p)^{3d-4} \gamma^{3d-4}+p\big(\big.1-\big.p\big)^{2d-2}\times\\&\gamma^{2d-3}(1-\gamma)\theta^{d-1}+p(1-p)^{2d-1}\times\\& \gamma^{2d-2}(1-\gamma)^{2}\theta^{d-2}+(1-p)^{d+1}(1-\gamma)\times\\& \gamma^{d-1}\beta\theta^{2d-3})+\binom{d}{2}(p^{2}(1-p)^{3d-4}\gamma^{3d-4}+\\&p(1-p)^{2d-2}(1-\gamma)\gamma^{2d-3}\theta^{d-1}+\\&(1-p)^{d}(1-\gamma)^2 \gamma^{d-2}\theta^{2d-2})\},\end{split} where \theta=p\gamma+(1-p)(1-\beta) .
Based on the above discussions, similarly, we list Table 3 to analyze the probabilities P^{i}_{c}(a^{-})\ (i\in\langle 8\rangle) that the faulty node a is correctly diagnosed.
Table 3. Probability of 8 Cases in Which Faulty Node a Is Correctly DiagnosedLocal State-Syndrome Pattern Probability of Correct Identification of
Faulty Node aFig.2(b) \theta^{d} Fig.3(b) d(1-\gamma)\gamma^{d - 1}p(1-p)^{d - 1}\theta^{d - 1} Fig.4(b) d(1-p)\beta\theta^{2d-2} Fig.5(b) d(d - 1)p(1 - p)^{d - 1}(1 - \gamma)\gamma^{d - 2}\theta^{d - 1}(p (1 - p)^{d - 2}\gamma^{d - 1}+ (1 - \gamma)\theta^{d - 1}) Fig.6(b) d(d - 1)(1 - p)^{2}\beta\theta^{2d - 3}(p(1 - \gamma)\times (1 - p)^{d - 2}\gamma^{d - 1}+\theta^{d - 1}) Fig.7(b) \binom{d}{2}(1-\gamma)^{2}p^{2}(\gamma(1-p))^{2d - 2}\theta^{d - 2} Fig.8(b) \binom{d}{2}\beta\gamma^{d - 1}(1-\gamma)p(1-p)^{d}\theta^{2d - 3} Fig.9(b) \binom{d}{2}{\beta}^{2}(1-p)^{2}\theta^{3d-4} Note that P_{c}(a^{-})=\sum\nolimits^{8}_{i=1}P^{i}_{c}(a^{-}) . Then, we derive the following theorem.
Theorem 3. For any node a\in V({\cal{G}}) , the probability that the faulty node a is correctly diagnosed is
\begin{split}P_{c}(a^-)=\;&\theta^{d}+d(1-\gamma)\gamma^{d-1}p(1-p)^{d-1}\theta^{d-1}+ d\beta(1-\\& p )\theta^{2d-2}+d(d-1)(1-\gamma)\gamma^{2d-3}p^{2}(1-\\&p)^{2d-3}\theta^{d-1} + d(d-1)(1-\gamma)^{2}\gamma^{d-2}p(1-\\&p)^{d-1}\theta^{2d-2}+\Bigg(d(d-1) (1-\gamma)\gamma^{d-1}\beta+\\&\binom{d}{2}\beta(1-\gamma)\gamma^{d-1}\Bigg)(p(1-p)^{d} \theta^{2d-3}\big)+\\& \Bigg(d(d-1)\beta+\binom{d}{2}{\beta}^{2}\Bigg)((1-p)^{2}\theta^{3d-4})+\\& \binom{d}{2}\gamma^{2d-2}(1-\gamma)^{2}p^{2}(1-p)^{2d-2}\theta^{d-2},\\[-5pt]\end{split} where \theta=p\gamma+(1-p)(1-\beta) .
According to Theorem 2 and Theorem 3, we obtain the probability that any node in {\cal{G}} is correctly diagnosed.
5. Global Performance Analysis of General Regular Graphs
In this section, we present the global performance analysis of {\cal{G}} in the continuous state through the Laplace transform and two fault distributions. That is, we need to show that Y_{c}/Y approaches to 1 and F_{c}/F approaches to 1, where Y (resp., F ) is the mathematical expectation of the probability of nodes diagnosed to be fault-free (resp., faulty), and Y_{c} (resp., F_{c} ) is the mathematical expectation of the probability that the fault-free (resp., faulty) nodes can be correctly diagnosed. In other words, all nodes can be correctly diagnosed with a high probability in {\cal{G}} .
Suppose that p is a random variable that can be expressed as p={\rm{e}}^{-m} . Then
Y=E(p)=\int^{\infty}_{0}{\rm{e}}^{-m}f(m){\rm d}m, where E(p) is the mathematical expectation of p , and f(m) is the probability density function of m .
Since m is also a random variable, we utilize the Laplace transform (denoted as L(s) ) of m to perform the probabilistic diagnosis of clustered faults. To be exact, for any s\geqslant 0 ,
L(s)=\int^{\infty}_{0}{\rm{e}}^{-sm}f(m){\rm d}m. Clearly, Y=L(1) and Y=1-F . To obtain the value of Y_c/Y and F_c/F , we need to prove that P_c(a^{+}) and P_c(a^{-}) are polynomials with respect to p . Thus, we derive Lemma 9
1 and Theorem 4.Lemma 9. Given any node a\in V({\cal{G}}) , the probability that a is correctly diagnosed is
1) P_{c}(a^{+})=1+\displaystyle\sum\limits^{3d-2}_{i=0}w_{i}p^{i} ,
2) P_c(a^{-})=\displaystyle\sum\limits^{3d-2}_{i=0}\hat{w}_{i}p^{i} .
Theorem 4. The mathematical expectation expressions Y_{c}/Y and F_{c}/F are determined as follows.
1) Y_{c}/Y=(L(1)+\displaystyle\sum\limits^{3d-2}_{i=0}w_{i}L(i+1))/L(1);
2) F_{c}/F = (\hat{w}_{0} + \displaystyle\sum\limits^{3d-2}_{i=1}(\hat{w}_{i} - \hat{w}_{i-1})L(i) - \hat{w}_{3d - 2}L(3d - 1))/ (1-L(1)).
Proof. 1) Clearly, Y=L(1), F=1-L(1) . By Lemma 9, the mathematical expectation of fault-free nodes diagnosed correctly is
\begin{split} Y_{c} =\ & E(pP_{c}(a^+)) \\ =\ &Ep\left(1+\displaystyle\sum\limits^{3d-2}_{i=0}w_{i}p^{i}\right)\\ =\ & Ep+\displaystyle\sum\limits^{3d-2}_{i=0}w_{i}Ep^{i+1} \\ =\ & L(1)+\displaystyle\sum\limits^{3d-2}_{i=0}w_{i}\int^{\infty}_{0}{\rm e}^{-(i+1)m}f(m){\rm d}m \\ =\ & L(1)+\displaystyle\sum\limits^{3d-2}_{i=0}w_{i}L(i+1). \end{split} 2) The mathematical expectation of faulty nodes diagnosed correctly is
\begin{aligned} F_{c} =\ & E((1-p)P_{c}(a^-))\\=\ & E((1-p)\displaystyle\sum\limits^{3d-2}_{i=0}\hat{w}_{i}p^{i}) \\=\ & \displaystyle\sum\limits^{3d-2}_{i=0}\hat{w}_{i}(Ep^{i}-Ep^{i+1}) \\=\ & \displaystyle\sum\limits^{3d-2}_{i=0}\hat{w}_{i}\left(\int^{\infty}_{0} {\rm{e}}^{-im}f(m){\rm d}m- \right.\left. \int^{\infty}_{0} {\rm{e}}^{-(i+1)m}f(m){\rm d}m\right) \\=\ & \displaystyle\sum\limits^{3d-2}_{i=0}\hat{w}_{i}(L(i)-L(i+1)) \\=\ & \hat{w}_{0}L(0)+\displaystyle\sum\limits^{3d-2}_{i=1}\hat{w}_{i}L(i)-\displaystyle\sum\limits^{3d-2}_{i=0}\hat{w}_{i}L(i+1)\\=\ & \hat{w}_{0}+\displaystyle\sum\limits^{3d-2}_{i=1}(\hat{w}_{i}-\hat{w}_{i-1})L(i)-\hat{w}_{3d-2}L(3d-1), \end{aligned} where w_{i} and \hat{w}_{i} are two parameters in Lemma 9.
□ By the results mentioned above, we discover that the Laplace transform L(s) , which is determined by the distribution of random variable m , plays an important role in the global performance analysis. Both the Weibull fault distribution and the Chi-square fault distribution are extensively utilized in fault diagnosis. In the following, we will explore the situations that all nodes in {\cal{G}} can be correctly diagnosed with a high probability under these two fault distributions.
5.1 Weibull Fault Distribution
Here, we investigate the probability that the nodes in {\cal{G}} are correctly diagnosed under the Weibull fault distribution.
Let m(\geqslant0) be a random variable to obey the Weibull fault distribution, and then its probability density function is
f(m)=((\xi m^{\xi-1})/\lambda^{\xi}){\rm{e}}^{-(m/\lambda)^{\xi}}, where \lambda>0 is a scale parameter and \xi>0 is a shape parameter.
For convenience, let \mu=m^{\xi-1}/\lambda^{\xi} . Then, the probability density function is f(m)=\xi\mu{\rm{e}}^{-m\mu}. The Laplace transform of m under the Weibull distribution is
L(s)=\int^{\infty}_{0} \xi\mu{\rm{e}}^{-sm}{\rm{e}}^{-\mu m}{\rm d}m =\dfrac{\xi\mu}{\mu+s}. Hence,
Y=L(1)=\dfrac{\xi\mu}{{\mu+1}},\ \ 1-L(1)=\dfrac{(1-\xi)\mu+1}{{\mu+1}}, \qquad L(i)=\dfrac{\xi\mu}{{\mu+i}},\ \ \dfrac{L(i+1)}{L(1)}=\dfrac{\dfrac{\xi\mu}{{\mu+i+1}}}{\dfrac{\xi\mu}{{\mu+1}}}=\dfrac{\mu+1}{{\mu+i+1}}. Combining the above four formulas with Theorem 4, we obtain the following lemma.
Lemma 10. The mathematical expressions Y_{c}/Y and F_{c}/F under the Weibull distribution are determined as follows.
1) Y_{c}/Y=1+\displaystyle\sum\limits^{3d-2}_{i=0}w_{i}\dfrac{\mu+1}{\mu+i+1};
2) \begin{array}{l} F_{c}/F = \dfrac{(1 - \xi)\mu + 1}{1 + \mu} \left( \hat{w}_{0} + \displaystyle\sum\limits^{3d-2}_{i=1}(\hat{w}_{i} - \hat{w}_{i+1})\dfrac{\xi\mu}{\mu+i}- \right.\end{array}\qquad \qquad\quad \qquad \left. \hat{w}_{3d-2}\dfrac{\xi\mu}{\mu+3d-1}\right).
Next, we need to show that the states of nodes in {\cal{G}} can be correctly diagnosed with a high probability. That is, Y_{c}/Y\rightarrow 1 and F_{c}/F\rightarrow 1 when \xi\rightarrow 0, \hat{w}_{0}\rightarrow 1 and d\rightarrow \infty .
Theorem 5. If k\rightarrow 0, \hat{w}_{0}\rightarrow 1 and d\rightarrow \infty , then Y_{c}/Y\rightarrow 1 and F_{c}/F\rightarrow 1 .
Proof. By Lemma 10, it is easy to verify that
0\leqslant 1-Y_{c}/Y\leqslant \displaystyle\sum\limits^{3d-2}_{i=0}w_{i}\dfrac{\mu+1}{\mu+i+1}\rightarrow 0, for \xi\rightarrow 0, \hat{w}_{0}\rightarrow 1 and d\rightarrow \infty . Thus,
\begin{split} F_{c}/F=\;&\dfrac{(1-\xi)\mu+1}{1+\mu}\Bigg(\hat{w}_{0}+\displaystyle\sum\limits^{3d-2}_{i=1}\left(\hat{w}_{i}-\hat{w}_{i+1}\right)\dfrac{\xi\mu}{\mu+i}-\Bigg.\\&\Bigg.\hat{w}_{3d-2} \dfrac{\xi\mu}{\mu+3d-1}\Bigg) \\ \rightarrow \ & \dfrac{\mu+1}{1+\mu}\Bigg(\hat{w}_{0}+0\displaystyle\sum\limits^{3d-2}_{i=1}\dfrac{\xi\mu}{\mu+i}-\Bigg.\Bigg.\hat{w}_{3d-2}\times0\Bigg)\\ \rightarrow \ & \dfrac{\mu+1}{1+\mu}\hat{w}_{0}\rightarrow \ 1, {\rm{for}}\ d\rightarrow \infty.\qquad\qquad\qquad\qquad\quad\square\end{split} Therefore, the diagnostic strategy can identify almost all nodes in {\cal{G}} successfully under the Weibull fault distribution.
5.2 Chi-square Fault Distribution
In the following, we discuss the probability that the nodes in {\cal{G}} are correctly diagnosed under the Chi-square fault distribution.
Let x(\geqslant0) be a random variable to obey the Chi-square fault distribution. Then, its probability density function is
f(x)=\dfrac{1}{2^{\zeta/2}\Gamma(\zeta/2)}x^{ \frac{\zeta}{2}{\tiny-1}}{\rm{e}}^{- \textstyle\frac{x}{2}}, where \zeta is a constant.
For convenience, let \sigma=\zeta/2 . Since the Chi-square fault distribution is a special case of the Gamma fault distribution, the mean of x is \lambda=2\sigma . Hence, the Laplace transform of x under the Chi-square fault distribution is
L(s)=\int^{\infty}_{0}{\rm{e}}^{-sx} f(x){\rm d}x =(1+\lambda s/\sigma)^{-\sigma}. Thus,
\begin{array}{l} Y=L(1)=(1+\lambda/\sigma)^{-\sigma}, \\ L(i)=(1+i\lambda/\sigma)^{-\sigma}, \\ L(i+1)/L(1)=\left(\dfrac{1+\lambda/\sigma}{1+(i+1)\lambda/\sigma}\right)^{-\sigma}. \end{array} By Theorem 4, we have the following lemma.
Lemma 11. The mathematical expectation expressions Y_c/Y and F_c/F under the Chi-square fault distribution are determined as follows.
1) Y_{c}/Y=1+\displaystyle\sum\limits^{3d-2}_{i=0}w_{i}\left(\dfrac{1+\lambda/\sigma}{1+(i+1)\lambda/\sigma}\right)^{-\sigma} ;
2) F_{c}/F = \dfrac{1}{1-(1+\lambda/\sigma)^{-\sigma}}\bigg(\hat{w}_{0} + \displaystyle\sum\limits^{3d-2}_{i=1}(\hat{w}_{i} - \hat{w}_{i+1})\times \Bigg.\qquad\quad\qquad\qquad\ (1+ i\lambda/\sigma)^{-\sigma}-\hat{w}_{3d-2}(1+(3d-1)\times \qquad\quad\qquad\qquad \lambda/\sigma)^{-\sigma}\bigg).
Next, we need to show that both Y_{c}/Y and F_{c}/F approach to 1, when \hat{w}_{0}\rightarrow 1 and d\rightarrow \infty .
Theorem 6. If \hat{w}_{0}\rightarrow 1 and d\rightarrow \infty , then Y_{c}/Y\rightarrow 1 and F_{c}/F\rightarrow 1 .
Proof. Since \zeta is a constant and \zeta>0 , when \hat{w}_{0}\rightarrow 1 , by Lemma 11, it is easy to see that
0\leqslant 1-Y_{c}/Y\leqslant \displaystyle\sum\limits^{3d-2}_{i=0}w_{i}(\dfrac{1+\lambda/\sigma}{1+(i+1)\lambda/\sigma})^{-\sigma}. Since \sigma=\zeta/2 , \lambda=2\sigma , we have
\left(\dfrac{1+\lambda/\sigma}{1+(i+1)\lambda/\sigma}\right)^{-\sigma}=\left(\dfrac{3}{1+2(i+1)}\right)^{-\zeta/2}. The monotonicity of the above function with respect to i implies
\left(\dfrac{3}{1+2(i+1)}\right)^{-\zeta/2}\rightarrow 0 \ {\rm{for}}\ {i\rightarrow \infty}. Hence,
\displaystyle\sum\limits^{3d-2}_{i=0}w_{i}\left(\dfrac{1+\lambda/\sigma}{1+(i+1)\lambda/\sigma}\right)^{-\sigma}\rightarrow 0 \ {\rm{for}}\ {d\rightarrow \infty}. Owing to the monotonicity of the function, we have
\begin{array}{l} \qquad (1+\lambda/\sigma)^{-\sigma}\rightarrow 0, \\ (1+(3d-1)\lambda/\delta)^{-\delta}\rightarrow 0\ {\rm{for}}\ {d\rightarrow \infty}.\end{array} Hence, when \hat{w}_{0}\rightarrow 1 and d\rightarrow \infty , we have
\begin{split} F_{c}/F=\;&\dfrac{1}{1-\left(1+\dfrac{\lambda}{\sigma}\right)^{-\sigma}}\Bigg(\hat{w}_{0}+\displaystyle\sum\limits^{3d-2}_{i=1}(\hat{w}_{i} - \hat{w}_{i+1})\Bigg(1 + \\& \dfrac{i\lambda}{\sigma}\Bigg)^{-\sigma} - \hat{w}_{3d-2}\left(1+\dfrac{\left(3d-1\right)\lambda}{\sigma}\right)^{-\sigma}\Bigg) \rightarrow1. \quad\square \end{split} In summary, the diagnostic strategy can identify almost all nodes of general regular graphs successfully under the Chi-square fault distribution.
6. Conclusions
In this paper, we derived the following conclusions and results.
1) We proposed a local diagnosis algorithm with linear time complexity for general graphs and analyzed its effectiveness.
2) Based on the algorithm, we computed the probability of correctly diagnosing any node in a d -regular and d -connected graph under the probabilistic PMC (Preparata Metze Chien) model. Our calculations indicate that the algorithm efficiently performs node diagnosis in this probabilistic model.
3) We investigated the scenarios in which all nodes in a d -regular and d -connected graph can be correctly diagnosed with a high probability under Weibull and Chi-square fault distributions. The analysis revealed that the algorithm exhibits excellent diagnostic performance under these fault distributions.
4) The research findings demonstrated that the probabilities of correctly diagnosing all nodes in a d -regular and d -connected graph approach to 1 in the continuous state under both fault distributions. This implies that the diagnosis algorithm can accurately diagnose almost all graph nodes in practical applications.
In the future, we will try to find a bigger k, which is a central parameter reflecting the size of a faction and determining whether there are faulty clusters in a multiprocessor system. The larger the value of k, the more likely all nodes in the faction are to be fault-free. We aim to use larger k to solve the probabilistic fault diagnosis for general regular networks.
-
Figure 1. Four cases in which node a is diagnosed as a fault-free node for k > 3. (a) a has more than three matching neighbors. (b) a has two matching neighbors. (c) a has exactly one matching neighbor, which has at least three matching neighbors. (d) a has exactly one matching neighbor, which has two matching neighbors.
表1 八种不同故障机群模式下无故障结点a被误诊的概率 故障机群模式 a 无故障结点被误诊的概率 Fig. 2(a) P_w^1({a^ + }){\text{ = }}{(1 - p)^d}{\gamma ^d} Fig. 3(a) P_w^2({a^ + }){\text{ = }}dp{(1 - p)^{2d - 2}}{\gamma ^{2d - 2}} Fig. 4(a) P_w^3({a^ + }){\text{ = }}d(1 - \gamma ){\gamma ^{d - 1}}{\theta ^{d - 1}}{(1 - p)^d} Fig. 5(a) P_w^4({a^ + }) {\text{ = }} d(d - 1)p{(1 -p)^{2d - 2}}{\gamma ^{2d - 3}} [p{(1 -p)^{d - 2}} {\gamma ^{d - 1}} +{\theta ^{d - 1}}(1 - \gamma ) Fig. 6(a) P_w^5({a^ + }){\text{ = }}d(d\; -1)(1\; - \gamma ){\gamma ^{d - 1}}{\theta ^{d - 2}}{(1 - p)^{d{\text{ + }}1}} [p{(1 - p)^{d - 2}} (1 - \gamma ){\gamma ^{d - 1}} + {\theta ^{d - 1}}\beta] Fig. 7(a) P_w^6({a^ + }){\text{ = }}\left( \begin{gathered} d \\ 2 \\ \end{gathered} \right){p^2}{(1 - p)^{3d - 4}}{\gamma ^{3d - 4}} Fig.8(a) P_w^7({a^ + }){\text{ = }}\left( \begin{gathered} d \\ 2 \\ \end{gathered} \right)p(1 - \gamma ){(1 - p)^{2d - 2}}{\gamma ^{2d - 3}}{\theta ^{d - 1}} Fig. 9(a) P_w^8({a^ + }){\text{ = }}\left( \begin{gathered} d \\ 2 \\ \end{gathered} \right){\gamma ^{d - 2}}{(1 - \gamma )^2}{(1 - p)^d}{\theta ^{2d - 2}} 表2 八种不同故障机群模式下故障结点a被正确诊断的概率 故障机群模式 故障结点a被正确诊断的概率 Fig. 2(b) P_c^1({a^ - }){\text{ = }}{\theta ^d} Fig. 3(b) P_c^2({a^ - }){\text{ = }}d(1 - \gamma ){\gamma ^{d - 1}}p{(1 - p)^{d - 1}}{\theta ^{d - 1}} Fig. 4(b) P_c^3({a^ - }){\text{ = }}d(1 - p)\beta {\theta ^{2d - 2}} Fig. 5(b) P_c^4({a^ - }){\text{ = }}d(d - 1)p{(1 - p)^{d - 1}}(1 \;-\; \gamma ){\gamma ^{d - 2}}{\theta ^{d - 1}}[p{(1 - p)^{d - 2}}{\gamma ^{d - 1}} + (1 - \gamma ){\theta ^{d - 1}}] Fig. 6(b) P_c^5({a^ - }){\text{ = }}\;d(d\; - 1){(1 - \;p)^2}\beta {\theta ^{2d - 3}}[p{(1 - p)^{d - 2}} (1 - \gamma ) {\gamma ^{d - 1}} + {\theta ^{d - 1}} ] Fig. 7(b) P_c^6({a^ - }){\text{ = }}\left( \begin{gathered} d \\ 2 \\ \end{gathered} \right){\gamma ^{2d - 2}}{(1 - \gamma )^2}{p^2}{(1 - p)^{2d - 2}}{\theta ^{d - 2}} Fig. 8(b) P_c^7({a^ - }){\text{ = }}\left( \begin{gathered} d \\ 2 \\ \end{gathered} \right)\beta {\gamma ^{d - 1}}(1 - \gamma )p{(1 - p)^d}{\theta ^{2d - 3}} Fig. 9(b) P_c^8({a^ - }){\text{ = }}\left( \begin{gathered} d \\ 2 \\ \end{gathered} \right){\beta ^2}{(1 - p)^2}{\theta ^{3d - 4}} Table 1 PMC Model
Tester a Testee b \delta(a, b) Fault-free Fault-free 0 Fault-free Faulty 1 Faulty Fault-free 0 or 1 Faulty Faulty 0 or 1 Note: The state of a node is “fault-free” means that this node can work normally, whereas that the state of a node is “faulty” means that this node cannot work normally. Table 2 Probabilistic PMC Model
Tester a Testee b \delta(a, b) Fault-free Fault-free 0 (P_{\delta(a^{+},\ b^{+})}=1) Fault-free Faulty 0 (P_{\delta(a^{+}, \ b^{-})} = 1 - \gamma) or 1 (P_{\delta( a^{+},\ b^{-} )}=\gamma) Faulty Fault-free 0 (P_{\delta(a^{-},\ b^{+})} = 1 - \gamma) or 1 (P_{\delta(a^{-},\ b^{+})}=\gamma) Faulty Faulty 0 (P_{\delta(a^{-},\ b^{-})} = \beta) or 1 (P_{\delta(a^{-},\ b^{-})} = 1 - \beta) Note: The state of a node is “fault-free” means that thisnode can work normally, whereas that the state of a node is“faulty” means that this node cannot work normally. Algorithm 1. {\mathtt{Local{\text{-}}Fault{\text{-}}Diagnosis}} Input: graph G=(V, E), the syndrome \delta Output: a fault-free node set T, a faulty node set F 1: (Initialization) Select node a\in V; 2: if there is a node b\in N(a) satisfying \delta(a,b)=0 then 3: if |\Gamma(a)|\geqslant3 then 4: T\leftarrow\Gamma(a)\cup\{a\}; 5: else 6: if |\Gamma(a)|=2 then 7: Suppose \Gamma(a)=\{a_{1}, a_{2}\}; 8: if there is i\in \{1, 2\} satisfying |\Gamma (a_{i}) - \{a\}| \geqslant 1 then 9: T\leftarrow\Gamma(a)\cup\Gamma(a_{i}); 10: else 11: F\leftarrow\Gamma(a)\cup\{a\}; 12: end if 13: else 14: if |\Gamma(a)|=1 then 15: Suppose \Gamma(a)=\{a_{1}\}; 16: if |\Gamma(a_{1})-\{a\}|\geqslant2 then 17: T\leftarrow\Gamma(a_{1})\cup\{a_{1}\}; 18: else 19: if |\Gamma(a_{1})-\{a\}|=1 then 20: Suppose \Gamma(a_{1})-\{a\}=\{b_{1}\}; 21: if |\Gamma(b_{1})-\{a_{1}\}|\geqslant1 then 22: T\leftarrow\Gamma(a_{1})\cup\Gamma(b_{1}); 23: else 24: F\leftarrow\Gamma(a_{1})\cup\{a_{1}\}; 25: end if 26: else 27: F\leftarrow \{a, a_{1}\}; 28: end if 29: end if 30: else 31: F\leftarrow \{a\}; 32: end if 33: end if 34: end if 35: else 36: F\leftarrow \{a\}; 37: end if 38: return T, F; Table 3 Probability of 8 Cases in Which Faulty Node a Is Correctly Diagnosed
Local State-Syndrome Pattern Probability of Correct Identification of
Faulty Node aFig.2(b) \theta^{d} Fig.3(b) d(1-\gamma)\gamma^{d - 1}p(1-p)^{d - 1}\theta^{d - 1} Fig.4(b) d(1-p)\beta\theta^{2d-2} Fig.5(b) d(d - 1)p(1 - p)^{d - 1}(1 - \gamma)\gamma^{d - 2}\theta^{d - 1}(p (1 - p)^{d - 2}\gamma^{d - 1}+ (1 - \gamma)\theta^{d - 1}) Fig.6(b) d(d - 1)(1 - p)^{2}\beta\theta^{2d - 3}(p(1 - \gamma)\times (1 - p)^{d - 2}\gamma^{d - 1}+\theta^{d - 1}) Fig.7(b) \binom{d}{2}(1-\gamma)^{2}p^{2}(\gamma(1-p))^{2d - 2}\theta^{d - 2} Fig.8(b) \binom{d}{2}\beta\gamma^{d - 1}(1-\gamma)p(1-p)^{d}\theta^{2d - 3} Fig.9(b) \binom{d}{2}{\beta}^{2}(1-p)^{2}\theta^{3d-4} -
[1] Somani A K, Agarwal V K, Avis D. A generalized theory for system level diagnosis. IEEE Trans. Computers, 1987, C-36(5): 538–546. DOI: 10.1109/TC.1987.1676938.
[2] Preparata F P, Metze G, Chien R T. On the connection assignment problem of diagnosable systems. IEEE Trans. Electronic Computers, 1967, EC-16(6): 848–854. DOI: 10.1109/PGEC.1967.264748.
[3] Chang N W, Hsieh S Y. Structural properties and conditional diagnosability of star graphs by using the PMC model. IEEE Trans. Parallel and Distributed Systems, 2014, 25(11): 3002–3011. DOI: 10.1109/TPDS.2013.290.
[4] Li X Y, Fan J X, Lin C K, Cheng B L, Jia X H. The extra connectivity, extra conditional diagnosability and t/k-diagnosability of the data center network DCell. Theoretical Computer Science, 2019, 766: 16–29. DOI: 10.1016/j.tcs.2018.09.014.
[5] Li X Y, Fan J X, Lin C K, Jia X H. Diagnosability evaluation of the data center network DCell. The Computer Journal, 2018, 61(1): 129–143. DOI: 10.1093/comjnl/bxx 057.
[6] Lin L M, Huang Y Z, Wang X D, Xu L. Restricted connectivity and good-neighbor diagnosability of split-star networks. Theoretical Computer Science, 2020, 824-825: 81–91. DOI: 10.1016/j.tcs.2020.04.015.
[7] Lv M J, Fan J X, Zhou J Y, Cheng B L, Jia X H. The extra connectivity and extra diagnosability of regular interconnection networks. Theoretical Computer Science, 2020, 809: 88–102. DOI: 10.1016/j.tcs.2019.12.001.
[8] Wang S Y, Wang Z H, Wang M J S, Han W P. g-Good-neighbor conditional diagnosability of star graph networks under PMC model and MM* model. Frontiers of Mathematics in China, 2017, 12(5): 1221–1234. DOI: 10.1007/s11464-017-0657-9.
[9] Zhu Q, Zhang J, Li L L. The h-extra connectivity and h-extra conditional diagnosability of bubble-sort star graphs. Discrete Applied Mathematics, 2018, 251: 322–333. DOI: 10.1016/j.dam.2018.03.077.
[10] Xu X, Zhou S M, Xu L. Diagnosabilities of regular networks under three-valued comparison models. International Journal of High Performance Computing and Networking, 2017, 10(4/5): 251–258. DOI: 10.1504/IJHPCN.2017.086529.
[11] Liang J R, Feng H, Du X J. Intermittent fault diagnosability of interconnection networks. Journal of Computer Science and Technology, 2017, 32(6): 1279–1287. DOI: 10.1007/s11390-017-1800-5.
[12] Sun X L, Zhou S M, Lv M J, Liu J F, Lian G Q. Intermittent fault diagnosability of some general regular networks. The Computer Journal, 2020, 63(1): 16–24. DOI: 10.1093/comjnl/bxy128.
[13] Blough D M, Sullivan G F, Masson G M. Efficient diagnosis of multiprocessor systems under probabilistic models. IEEE Trans. Computers, 1992, 41(9): 1126–1136. DOI: 10.1109/12.165394.
[14] Fussell D, Rangarajan S. Probabilistic diagnosis of multiprocessor systems with arbitrary connectivity. In Proc. the 19th International Symposium on Fault-Tolerant Computing. Digest of Papers, Jun. 1989, pp.560–565. DOI: 10.1109/FTCS.1989.105636.
[15] Tang Q Y, Song X Y. Diagnosis of parallel computers arbitrary connectivity. IEEE Trans. Computers, 1999, 48(7): 757–761. DOI: 10.1109/12.780885.
[16] Rangarajan S, Fussell D. Diagnosing arbitrarily connected parallel computers with high probability. IEEE Trans. Computers, 1992, 41(5): 606–615. DOI: 10.1109/12.142687.
[17] Huang K Y, Agarwal V K, Thulasiraman K. Diagnosis of clustered faults and wafer testing. IEEE Trans. Computer-Aided Design of Integrated Circuits and Systems, 1998, 17(2): 136–148. DOI: 10.1109/43.681263.
[18] Tang Q Y, Song X Y, Wang Y K. Diagnosis of clustered faults for identical degree topologies. IEEE Trans. Computer-Aided Design of Integrated Circuits and Systems, 1999, 18(8): 1192–1201. DOI: 10.1109/43.775637.
[19] Lu X J, Li J P, Seo C J. Probabilistic diagnosis of clustered faults for shared structures. Mathematical and Computer Modelling, 2009, 49(3/4): 623–634. DOI: 10.1016/j.mcm.2008.06.011.
[20] Lv M J, Zhou S M, Sun X L, Lian G Q, Liu J F, Wang D J. Probabilistic diagnosis of clustered faults for hypercube-based multiprocessor system. Theoretical Computer Science, 2019, 793: 113–131. DOI: 10.1016/j.tcs.2019.06.023.
[21] Akers S B, Krishnamurthy B. A group-theoretic model for symmetric interconnection networks. IEEE Trans. Computers, 1989, 38(4): 555–566. DOI: 10.1109/12.21148.
[22] Compeau P E C. Girth of pancake graphs. Discrete Applied Mathematics, 2011, 159(15): 1641–1645. DOI: 10. 1016/j.dam.2011.06.013.
[23] Song S L, Zhou S M, Li X Y. Conditional diagnosability of burnt pancake networks under the PMC model. The Computer Journal, 2016, 59(1): 91–105. DOI: 10.1093/ comjnl/bxv066.
-
其他相关附件
-
本文英文pdf
2023-4-7-1099-Highlights 点击下载(731KB) -
本文附件外链
https://rdcu.be/dqKCX -
DOCX格式
2023-4-7-1099-Chinese Information 点击下载(168KB)
-


 下载:
下载:
